Exceptional Student Services

Path
specialeducation
Contact
Contact name or title
ESS Reception Desk
Contact phone number
(602) 542-4013

Indicator 12: Secondary Transition

Indicator 12: Secondary Transition

What Indicator 12 Is

Indicator 12 measures the percentage of children referred from Early Intervention who are found eligible for special education services and who have an Individualized Education Program (IEP) implemented on their third birthday.

Why Indicator 12 Is Important

This indicator ensures that children are evaluated in a timely way so that those determined to be eligible begin receiving needed services and supports at age three. 

How Indicator 12 Is Measured

Schools annually report the percentage of children who were receiving Arizona Early Intervention Services (AzEIP) and were determined to be eligible for preschool special education services. 

Data for Indicator 12
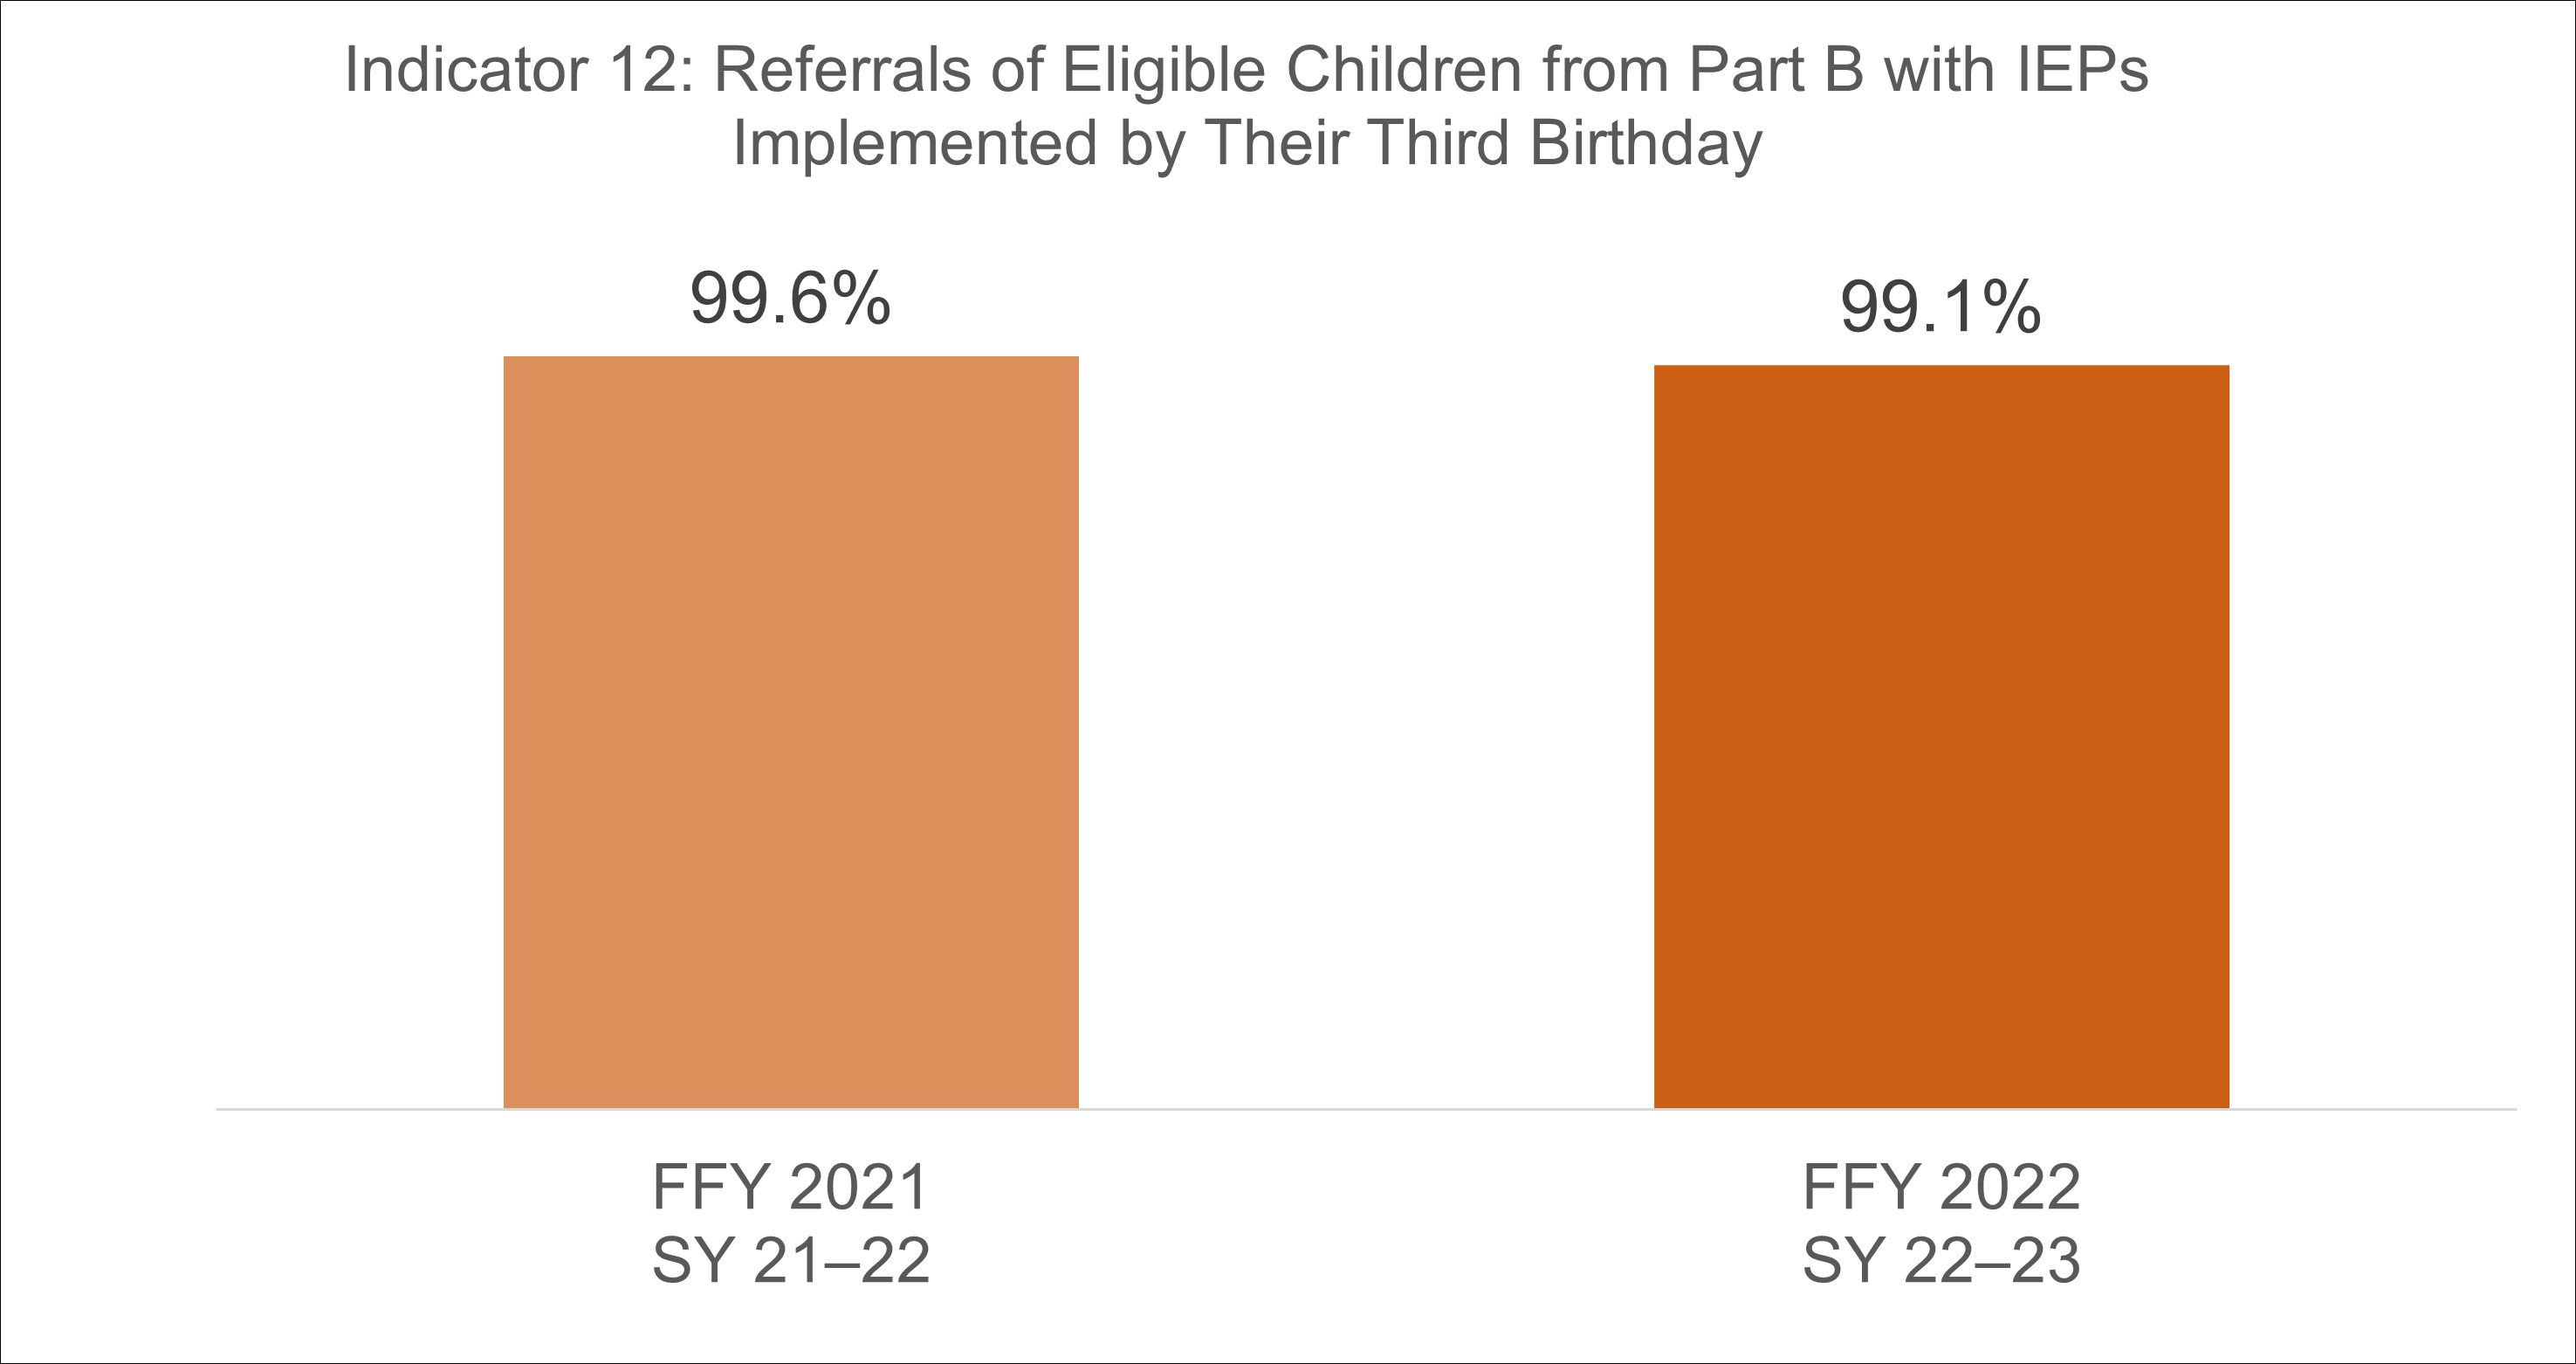
Federal Fiscal Year (FFY)

2021

2022

Data from School Year (SY)

2021–2022

2022–2023

Indicator 12 data

99.6%

99.1%

More Information

Arizona's Early Childhood Special Education web page

Arizona's Transition from Early Intervention Services web page

Questions or comments can be emailed to the ESS Operations inbox.

< Indicator 11SPP/APR HOMEIndicator 13 >

Indicator 11: Child Find

Indicator 11: Child Find

What Indicator 11 is

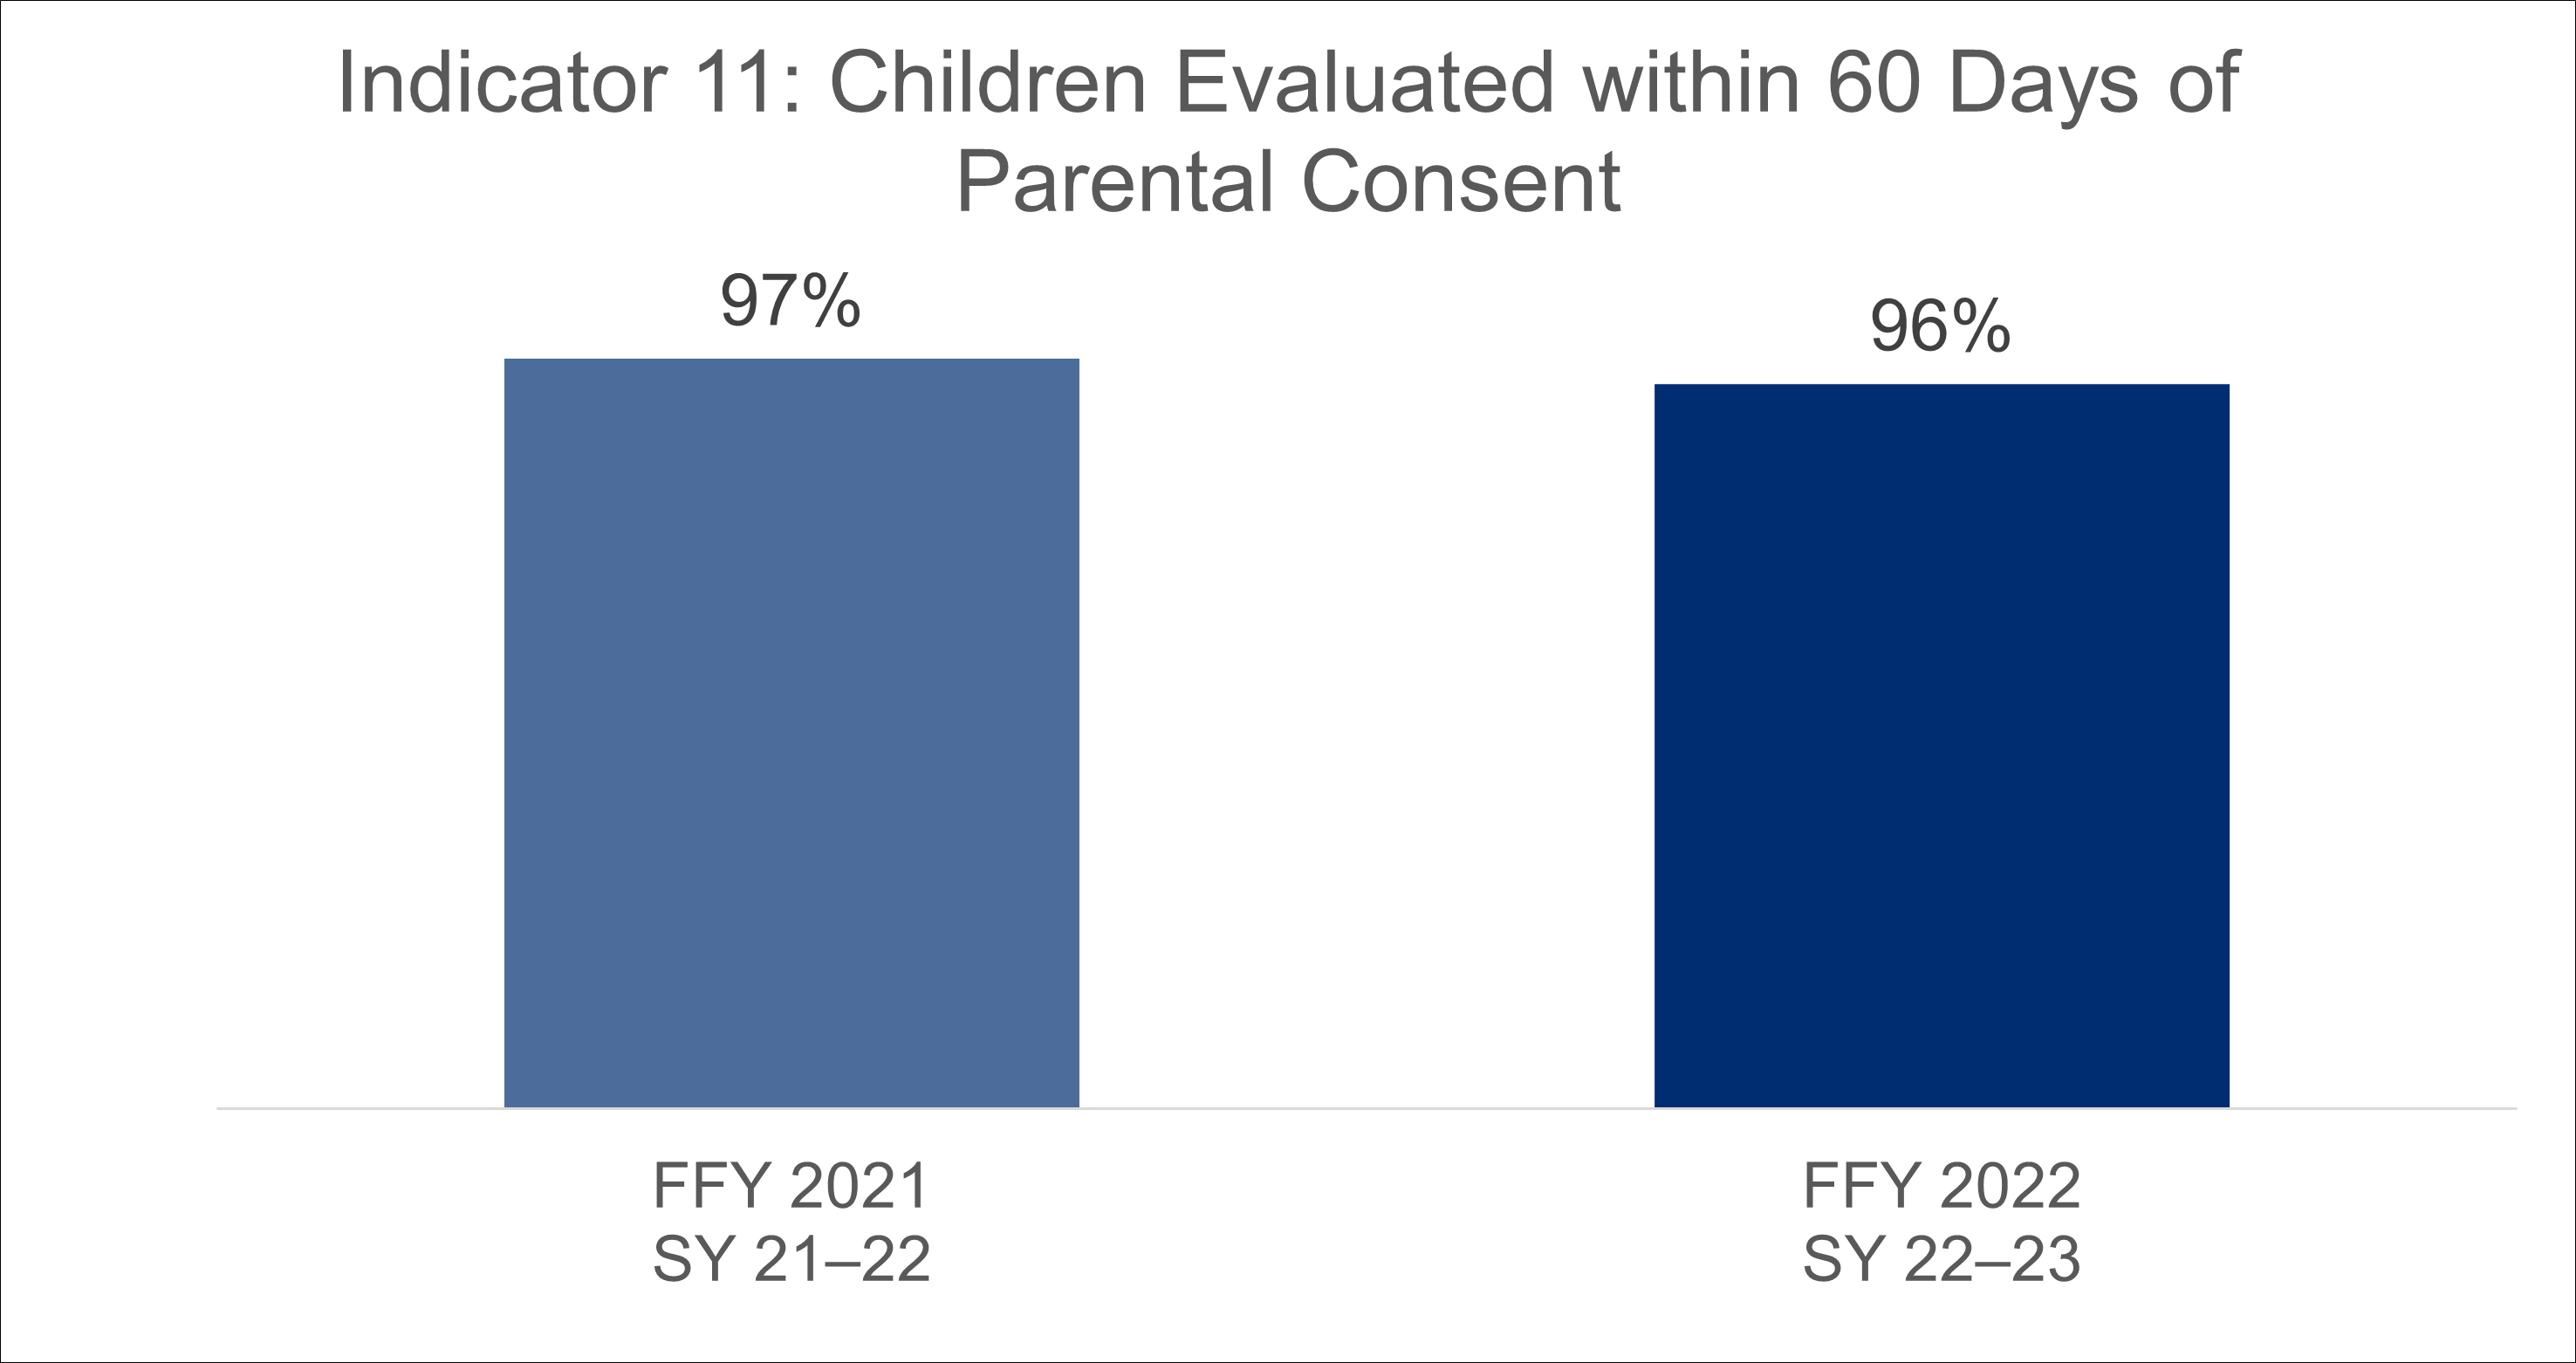
Indicator 11 collects data to determine whether students receive initial evaluations and whether eligibility for special education is determined within the Arizona timeline of 60 days.

Why Indicator 11 is important

It is the Public Education Agency's (PEA) responsibility to have a student evaluated within 60 days of receiving informed written consent from the parent. This indicator ensures that PEAs are working in a timely manner. 

How Indicator 11 is measured

Data is collected from Arizona’s monitoring system and is based upon a review of a sample of files from PEAs in year 4 of their monitoring cycle.

Data for Indicator 11

Indicator 11 Graph FFY21 FFY22.png

Federal Fiscal Year (FFY)

2021

2022

Data from School Year (SY)

2021–2022

2022–2023

Indicator 11 data

97%

96%

More Information

Arizona's Program Support and Monitoring web page

Questions or comments can be emailed to the ESS Operations inbox.

< Indicator 10SPP/APR HOMEIndicator 12 >

Indicator 10: Disproportionate Representation in Specific Disability Categories

Indicator 10: Disproportionate Representation in Specific Disability Categories

What Indicator 10 is

Indicator 10 looks at different racial/ethnic categories in a Public Education Agency (PEA). Within each category, Indicator 9 will then compare the disability category of students.

Why Indicator 10 is important

Indicator 10 ensures that PEAs have appropriate policies, procedures, and practices regarding the identification of students with disabilities.

How Indicator 10 is measured

Indicator 10 measures the percentage of students from specific racial/ethnic groups in a Public Education Agency (PEA) and who have a specific disability. That percentage is then compared to the State rate for children with IEPs from the same racial/ethnic group and disability category. If the PEA has a rate of identification three times or higher than the state rate for three consecutive years, the PEA is flagged for a review. The State then conducts a review of the PEA's policies, procedures, and practices to see if the disproportionate representation is due to result of inappropriate identification.

Data for Indicator 10

For Indicator 10, there were no PEAs in SY 22–23 that were also identified in SY 21–22 and SY 20–21; therefore, the data for indicator 10 is 0%.

More Information

Questions or comments can be emailed to the ESS Operations inbox.

< Indicator 9SPP/APR HOMEIndicator 11 >

Indicator 9: Disproportionate Representation

Indicator 9: Disproportionate Representation

What Indicator 9 is

Indicator 9 compares the races/ethnicities of students with disabilities to the races/ethnicities of students without disabilities in a Public Education Agency (PEA).

Why Indicator 9 is important

Indicator 9 ensures that PEAs have appropriate policies, procedures, and practices regarding the identification of students with disabilities.

How Indicator 9 is measured

Indicator 9 measures the percentage of students in a Public Education Agency (PEA), from a specific racial/ethnic groups, who have an IEP. That percentage is then compared to State rate for children with IEPs from the same racial/ethnic group. If the PEA has a rate of identification three times or higher than the state rate for three consecutive years, the PEA is flagged for a review. The State then conducts a review of the PEA's policies, procedures, and practices to see if the disproportionate representation is due to result of inappropriate identification.

Data for Indicator 9

For indicator 9, there were no PEAs in SY22-23 that were also identified in SY 21-22 and SY 20-21, therefore the data for indicator 9 is 0%.

More Information

Questions or comments can be emailed to the ESS Operations inbox.

< Indicator 8SPP/APR HOMEIndicator 10 >

Indicator 8: Parent Involvement

Indicator 8: Parent Involvement

What Indicator 8 Is

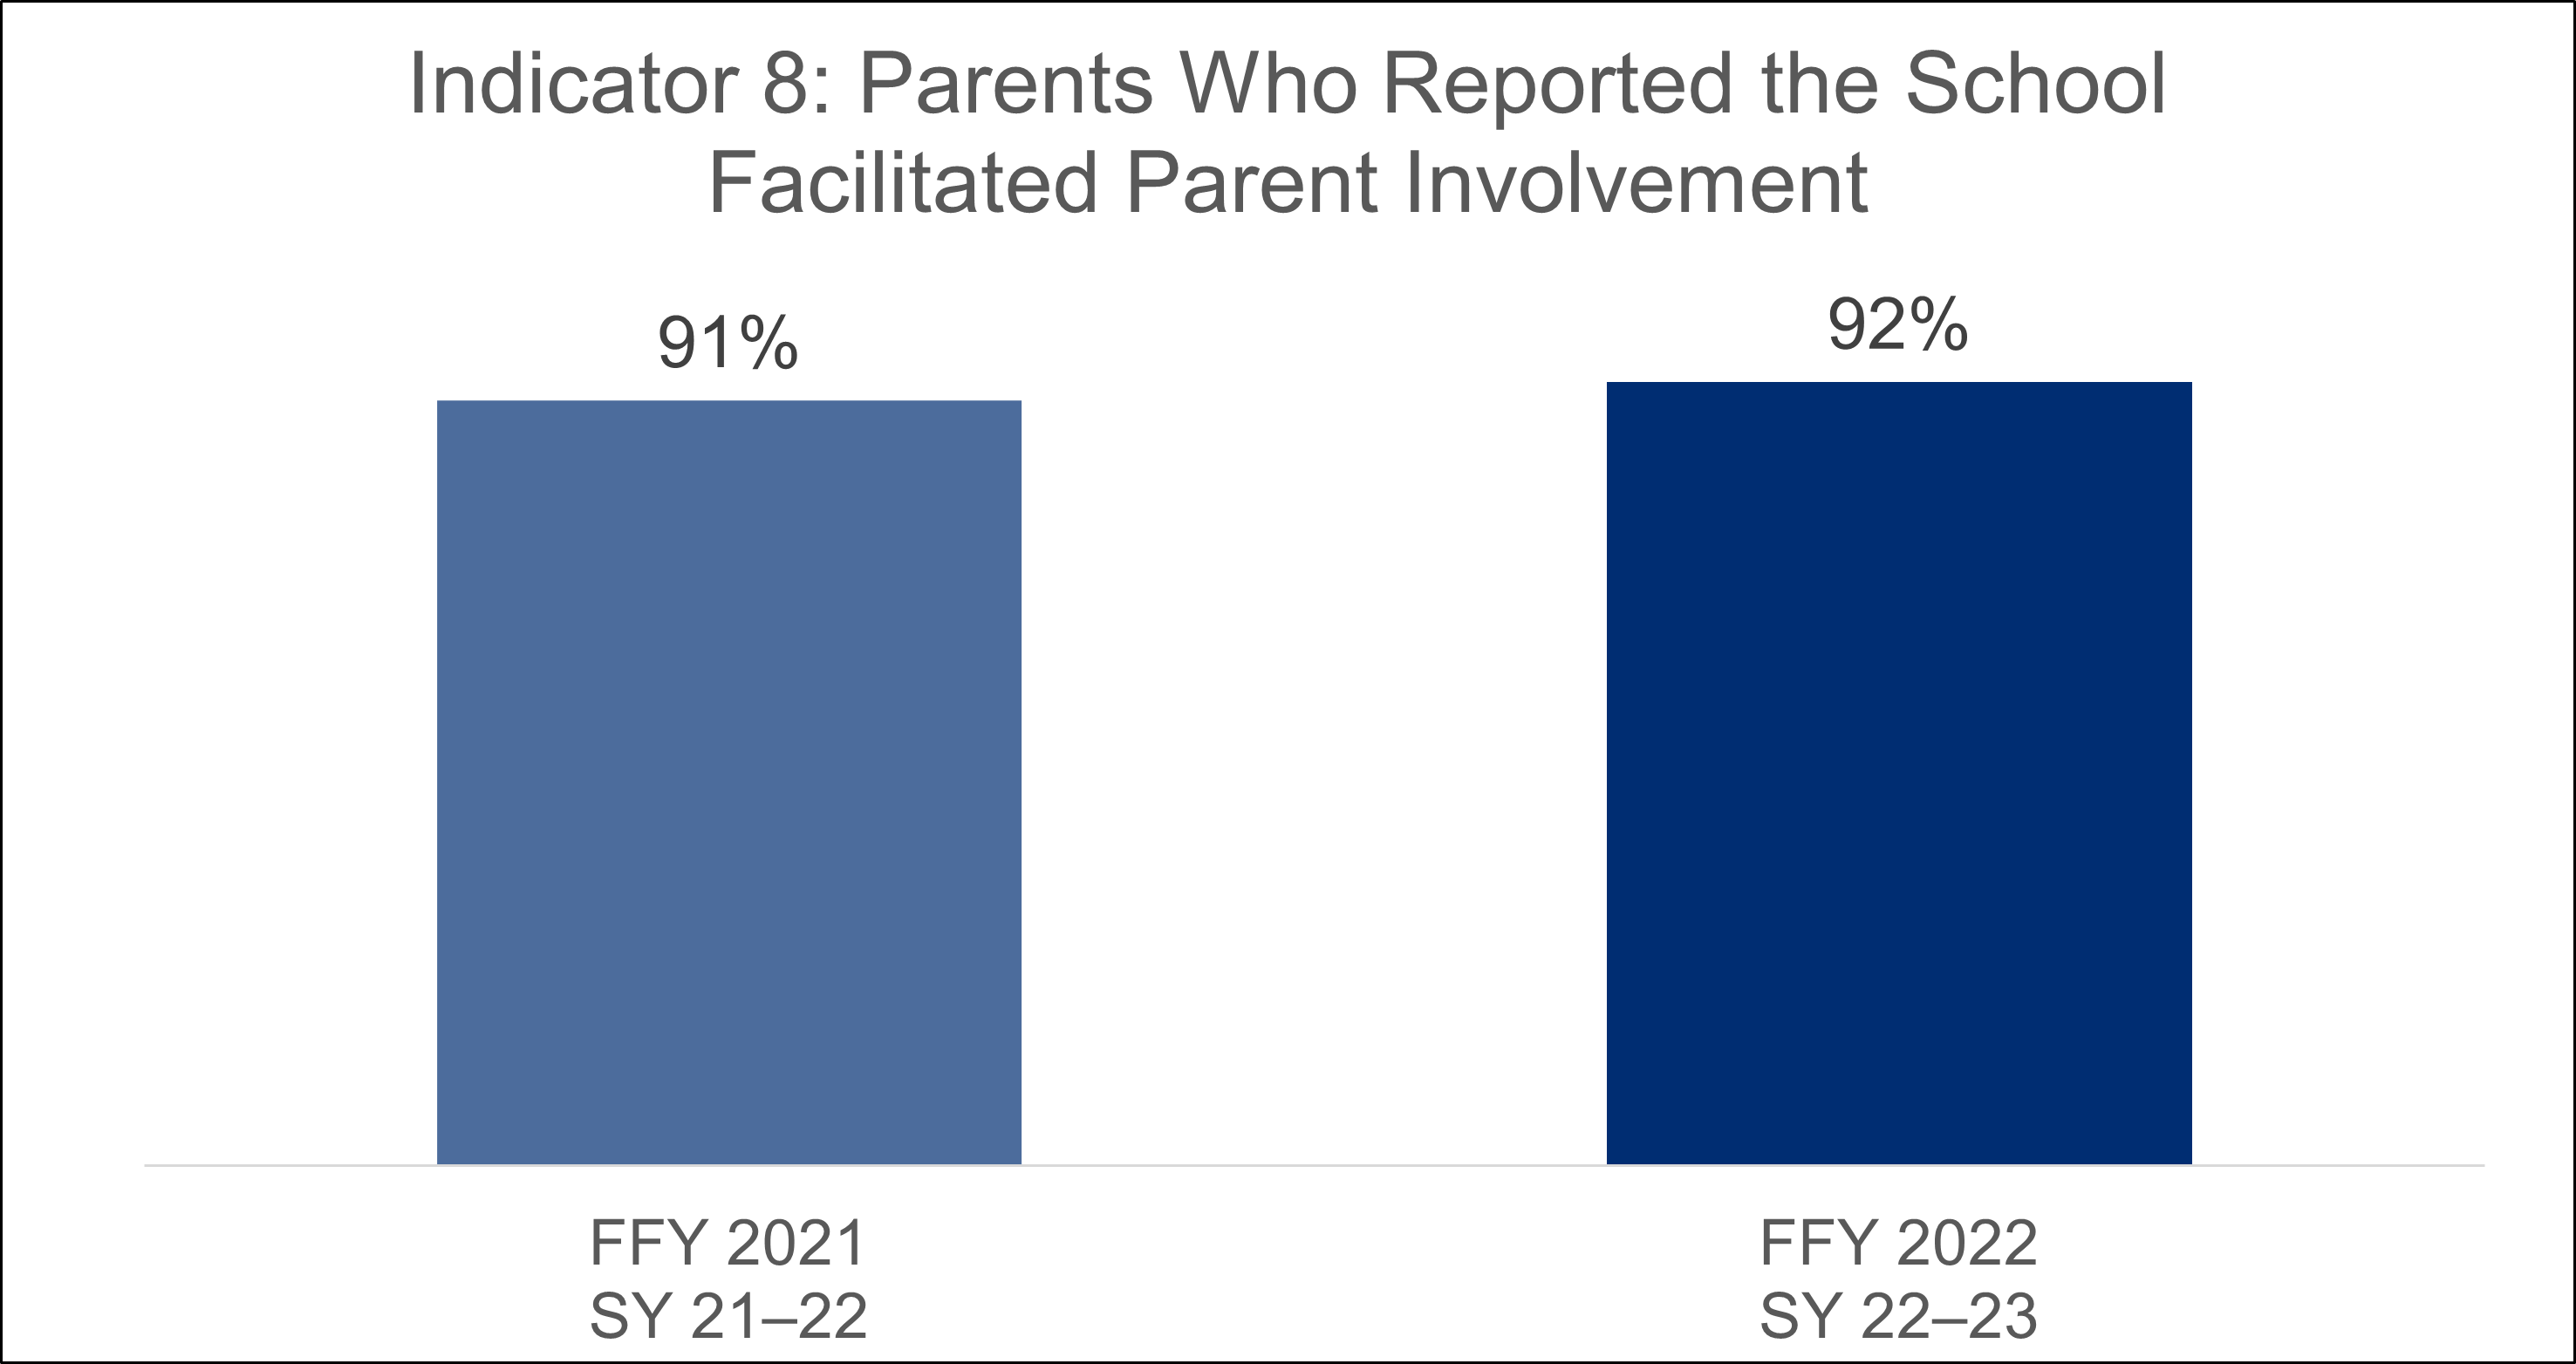
Indicator 8 reports the percentage of parents with a child receiving special education services who report that schools facilitated parent involvement as a means of improving services and results for children with disabilities.

Why Indicator 8 Is Important

Indicator 8 is a survey that provides Public Education Agencies (PEA) an opportunity to hear from parents. By means of the survey, PEAs can see if parents of children who receive special education services think that schools involve parents in a way that improves services and results for children with disabilities.

How Indicator 8 Is Measured

The survey is given to parents to complete each year. The survey answers are used to find the agreement rate for Indicator 8.

Data for Indicator 8

Federal Fiscal Year (FFY)20212022
Data from School Year (SY)2021–20222022–2023
Indicator 8 data91%92%

More Information

Arizona's Parent Involvement Survey information for families

Arizona's Parent Involvement Survey information for schools

Questions or comments can be emailed to the ESS Operations inbox.

< Indicator 7SPP/APR HOMEIndicator 9 >

Indicator 7: Preschool Outcomes

Indicator 7: Preschool Outcomes

What Indicator 7 Is

Indicator 7 collects information for children with IEPs, ages 3–5, who are enrolled in a preschool program. The indictor looks at how much progress children make between the time they enter and exit the program. 

Why Indicator 7 Is Important

Indicator 7 measures progress in critical areas such as social/emotional health as well as physical and cognitive development. Measuring the progress in these areas can inform families and educators about a child's strengths and areas of need.

How Indicator 7 Is Measured

Indicator 7 measures the percent of preschool children aged 3 through 5 with IEPs who demonstrate improvement in the following areas:

  1. 7A. Positive social-emotional skills (including social relationships)
  2. 7B. Acquisition and use of knowledge and skills (including early language/ communication and early literacy)
  3. 7C. Use of appropriate behaviors to meet their needs

For each outcome, the state must report the percent of children who qualify for the following two summary statements:

  1. Summary Statement 1: Of those preschool children who entered the preschool program below age expectations in each Outcome, the percent who substantially increased their rate of growth by the time they turned 6 years of age or exited the program.
  2. Summary Statement 2: The percent of preschool children who were functioning within age expectations in each Outcome by the time they turned 6 years of age or exited the program.

Data for Indicator 7A

Positive social-emotional skills (including social relationships)

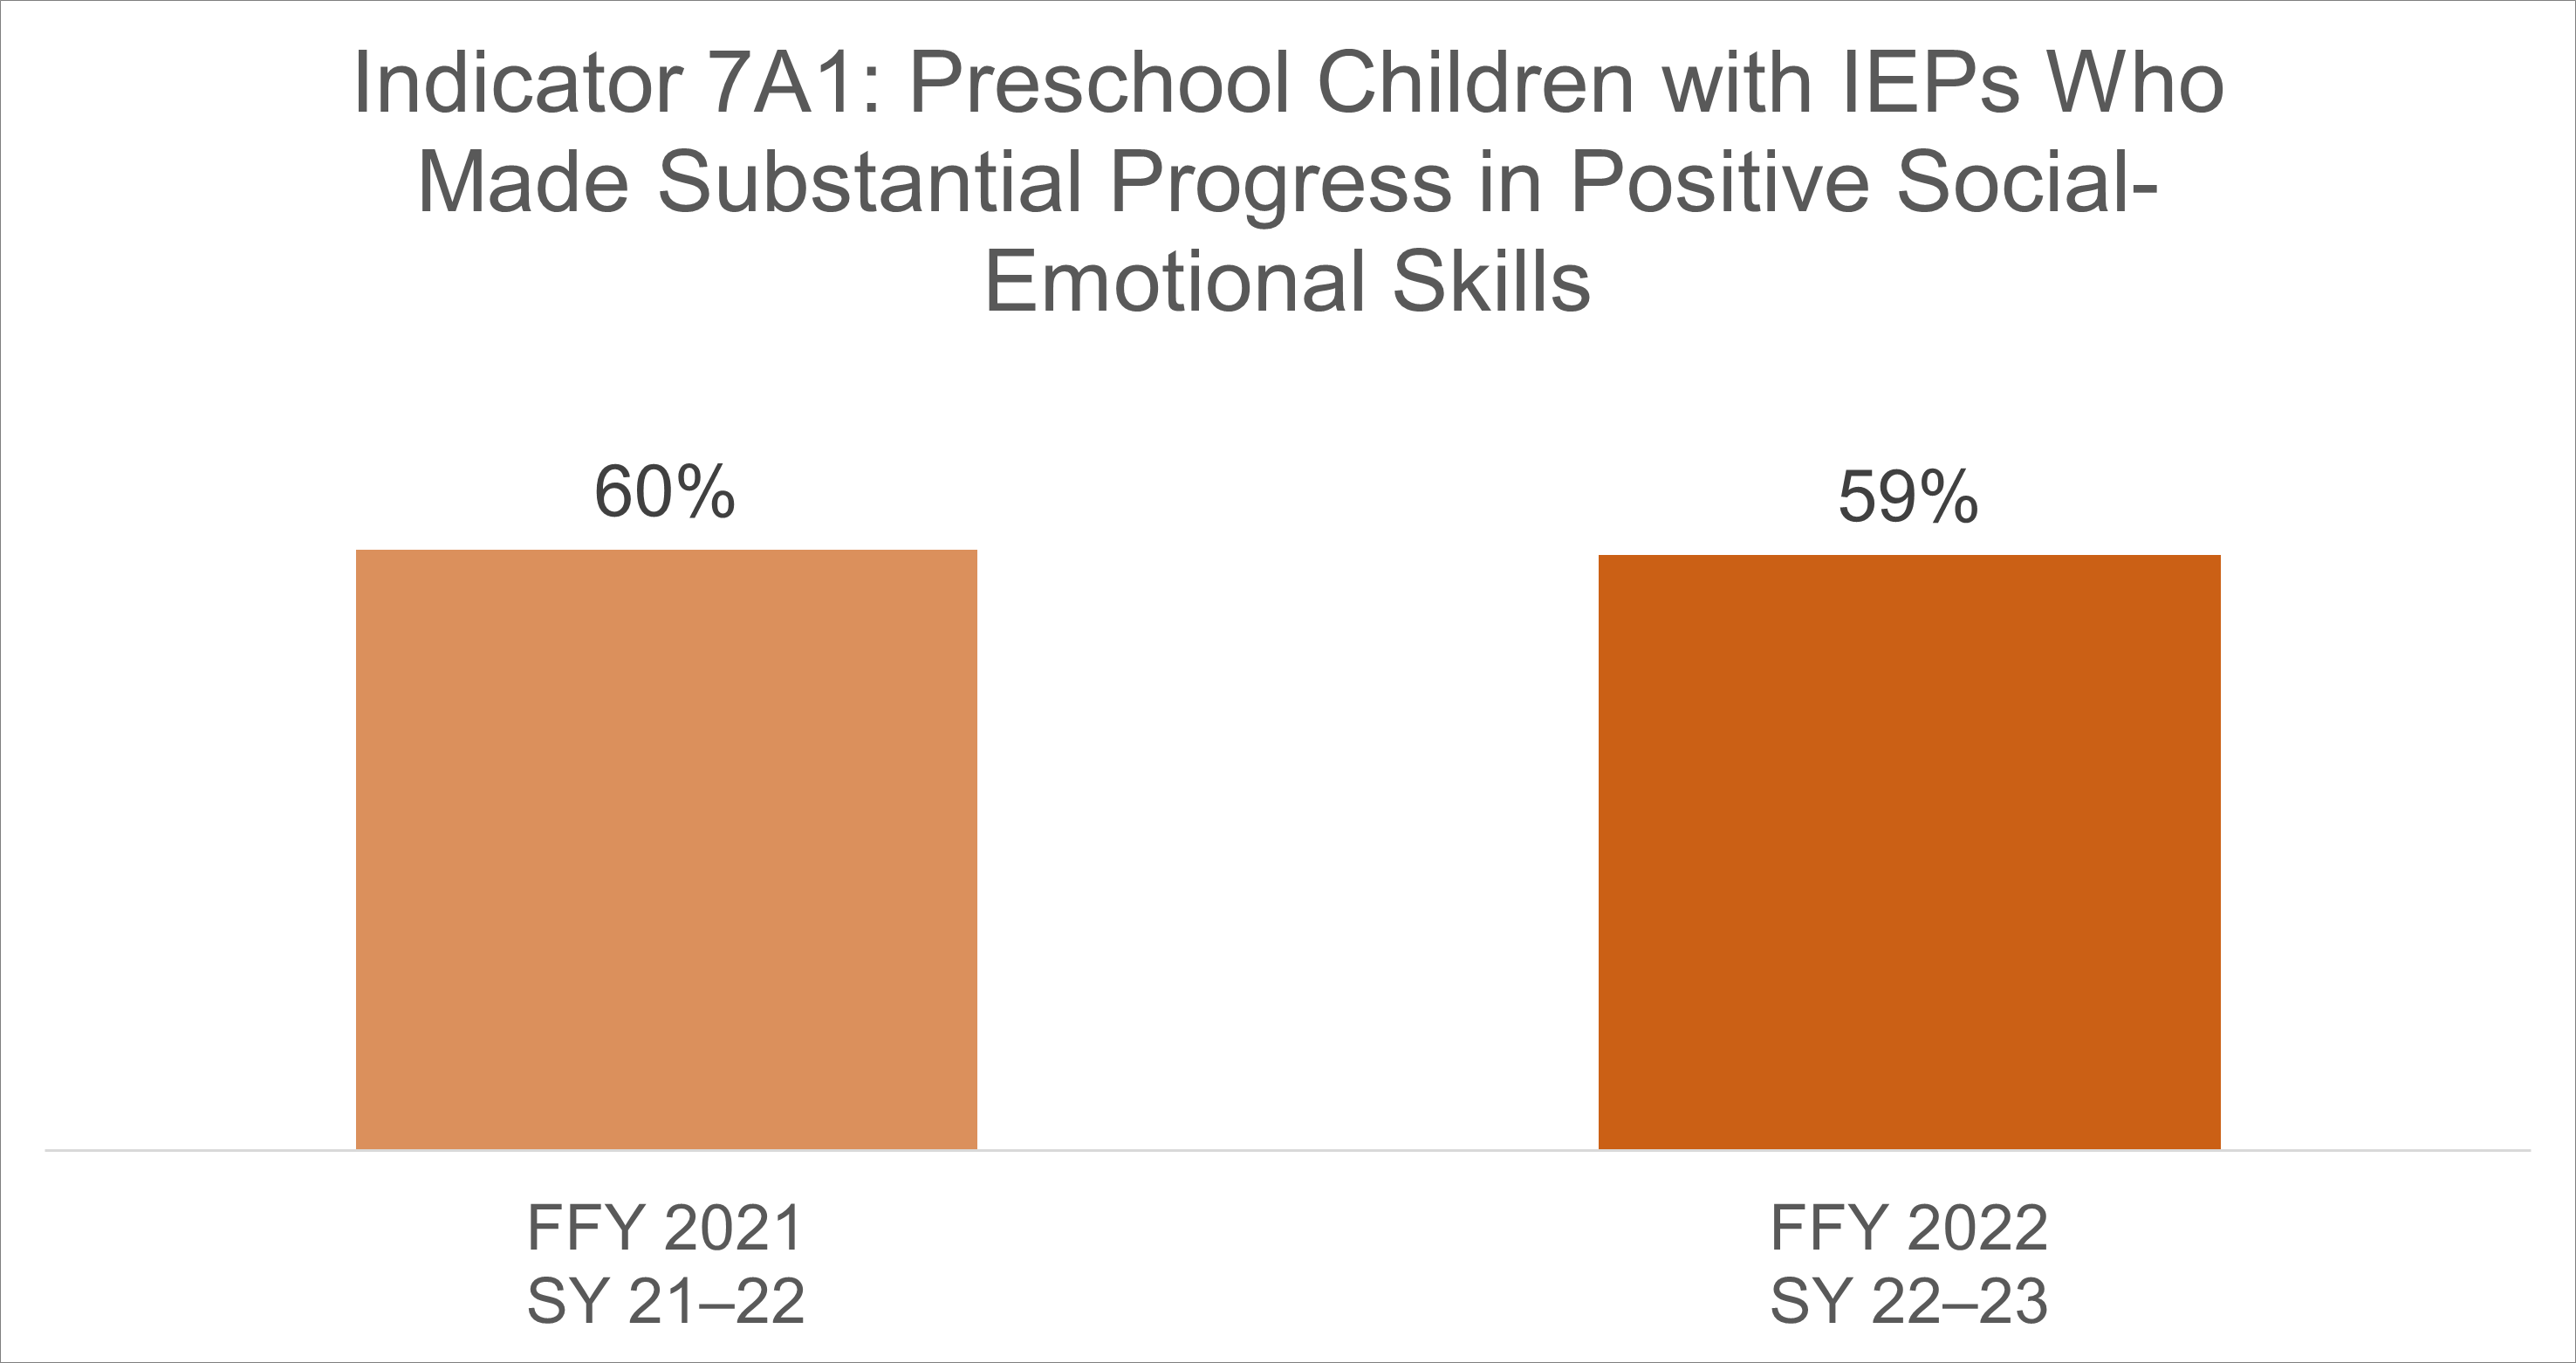
Indicator 7A1 FFY21 FFY22.png
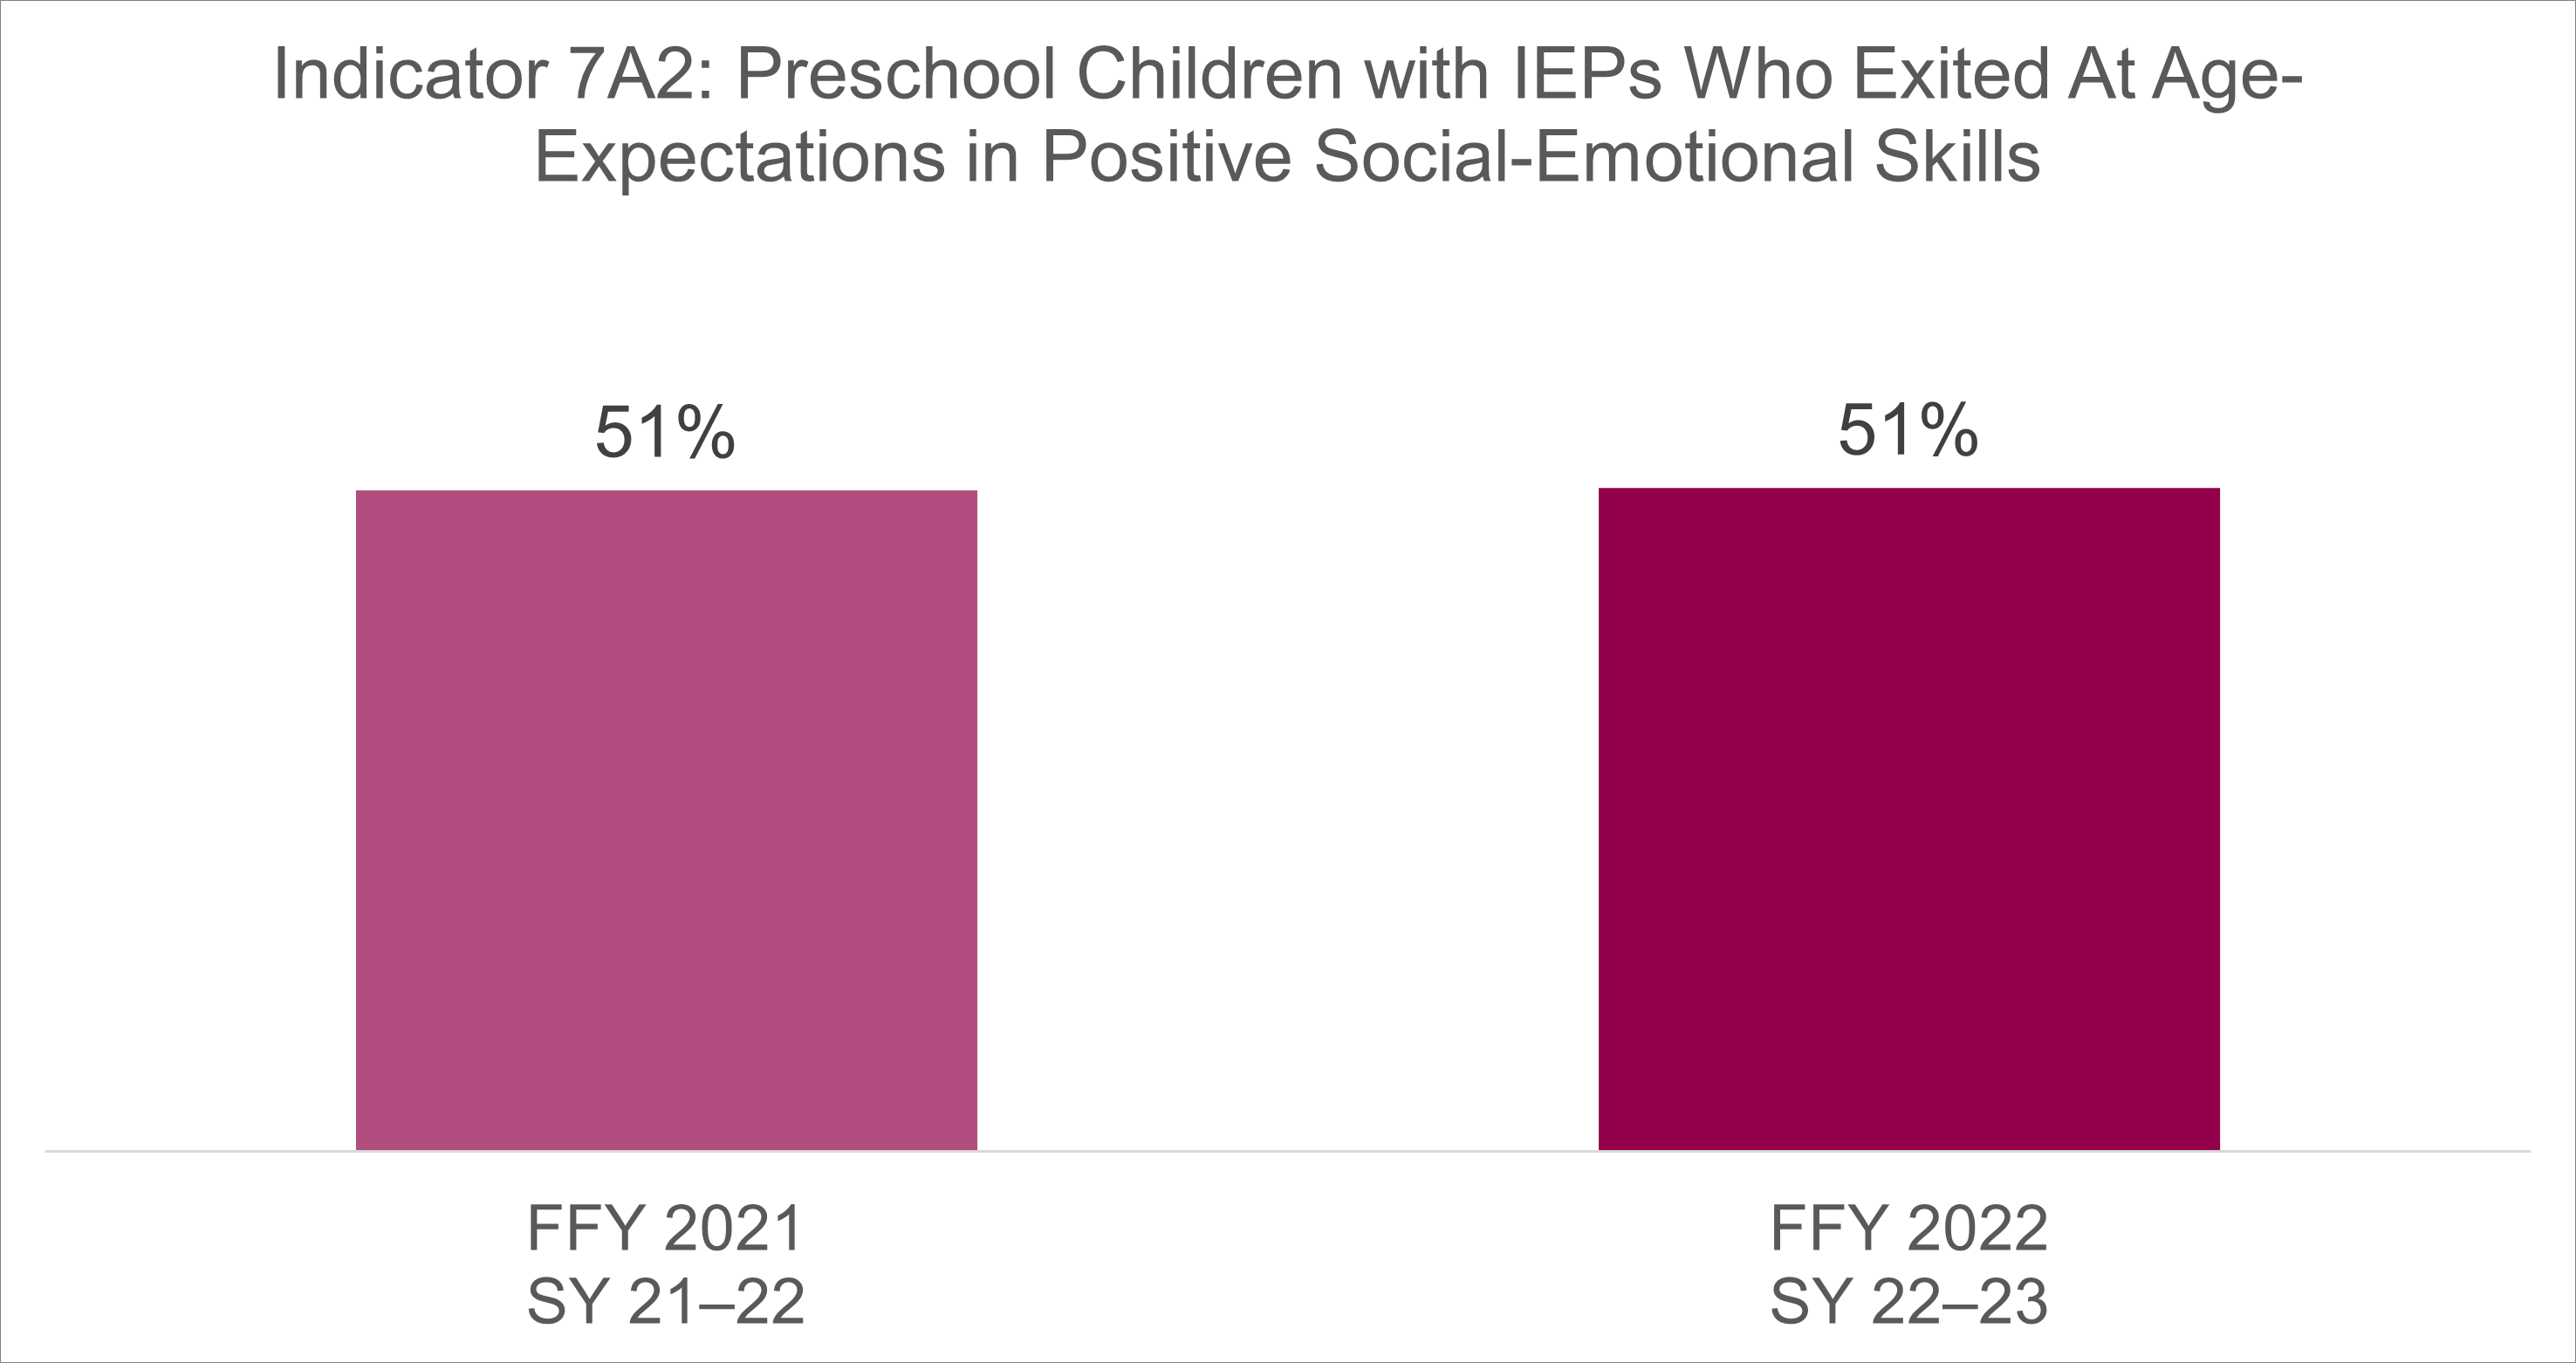
Indicator 7A2 FFY21 FFY22.png
Federal Fiscal Year (FFY)20212022
Data from School Year (SY)2021–20222022–2023
7A160%59%
7A251%51%

Data for Indicator 7B

Acquisition and use of knowledge and skills (including early language/ communication and early literacy)

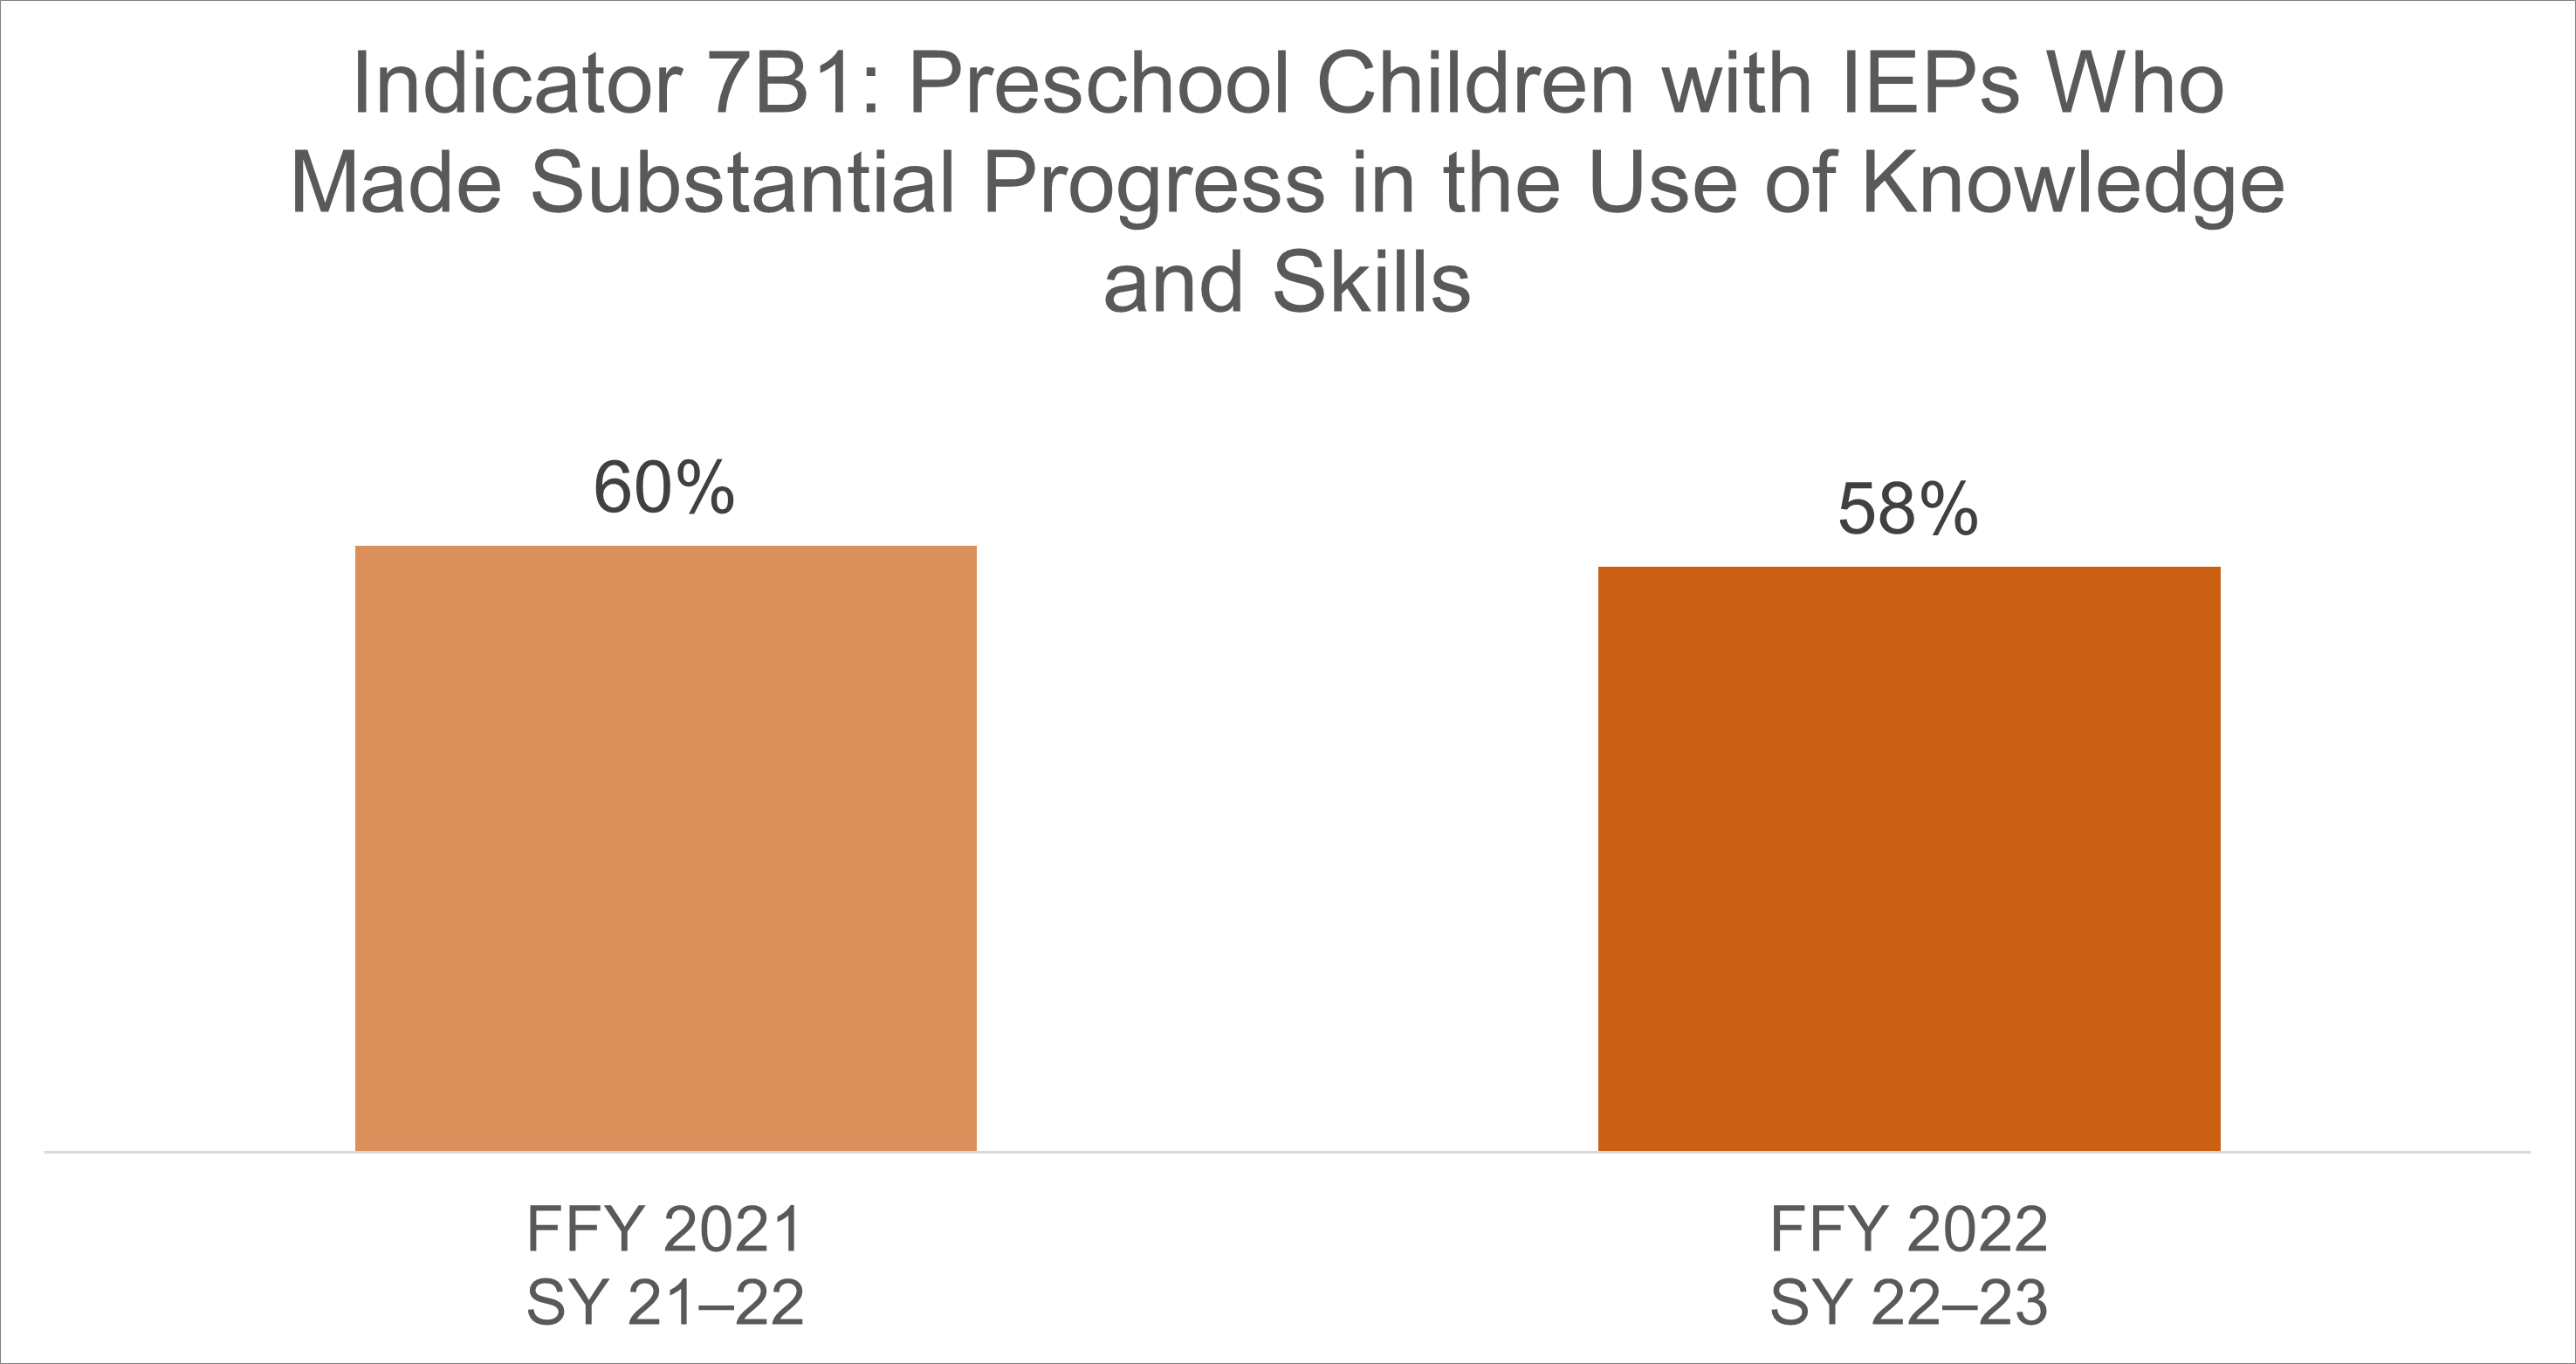
Indicator 7b1 FFY21 FFY22.png
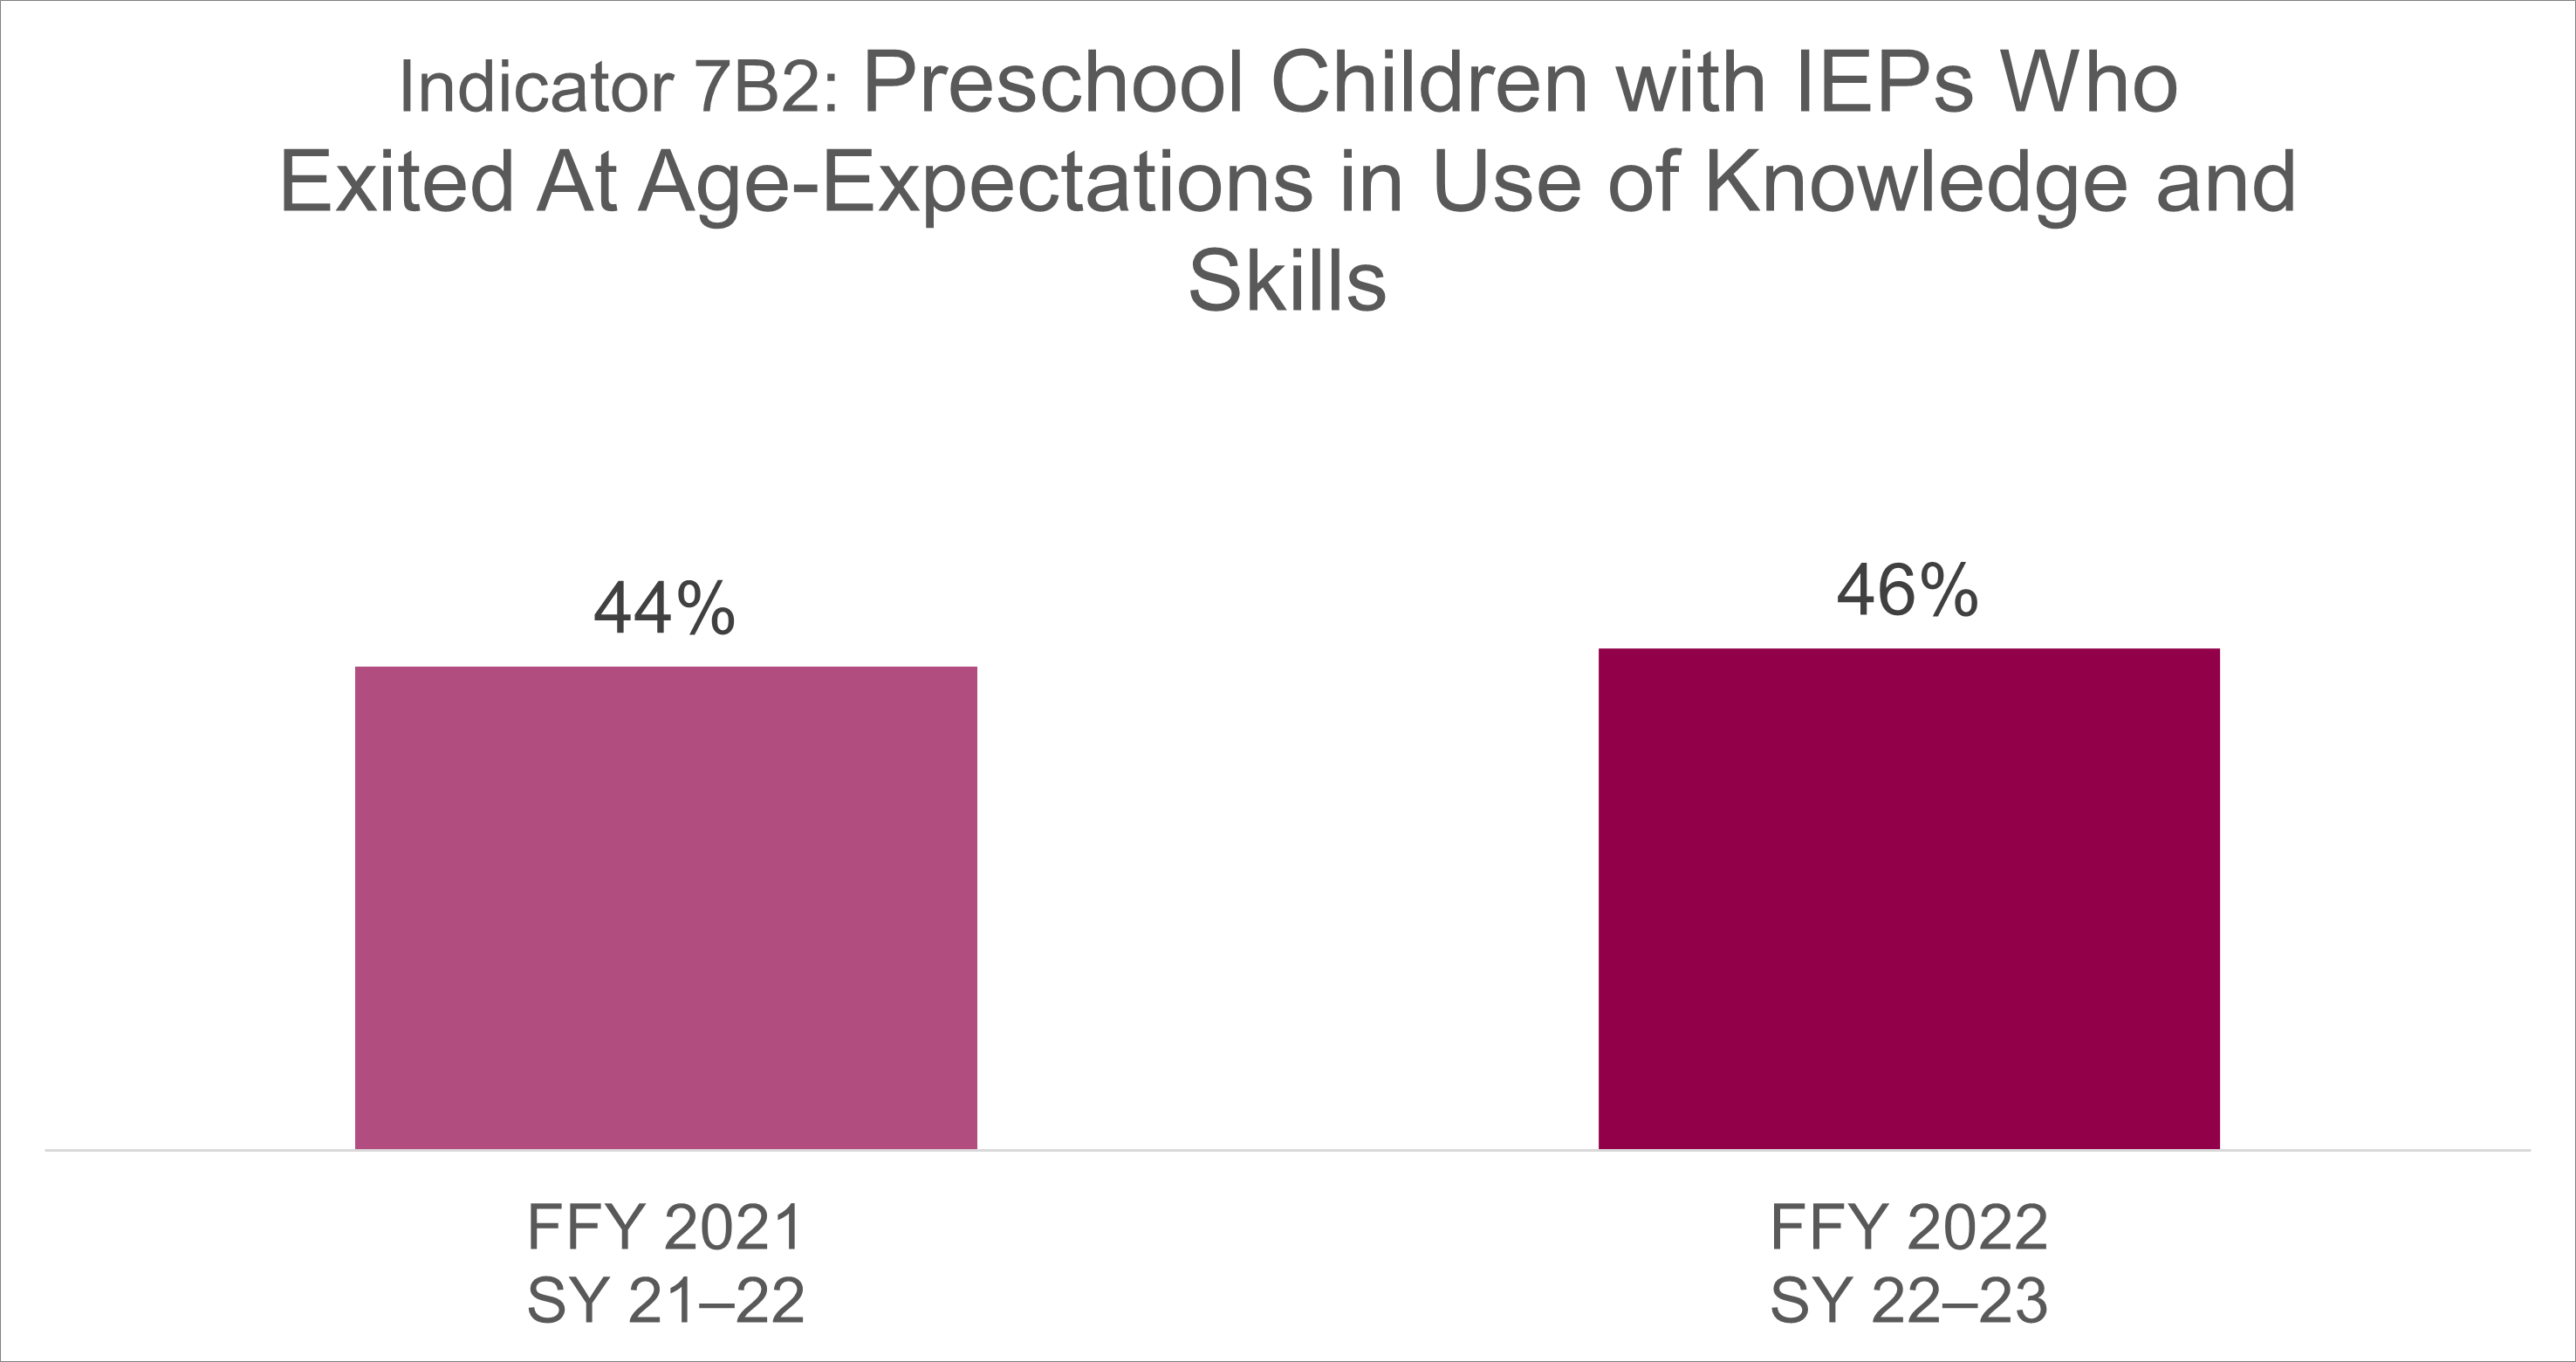
Indicator 7b2 FFY21 FFY22.png
Federal Fiscal Year (FFY)20212022
Data from School Year (SY)2021–20222022–2023
7B160%58%
7B244%46%

Data for Indicator 7C

Use of appropriate behaviors to meet their needs

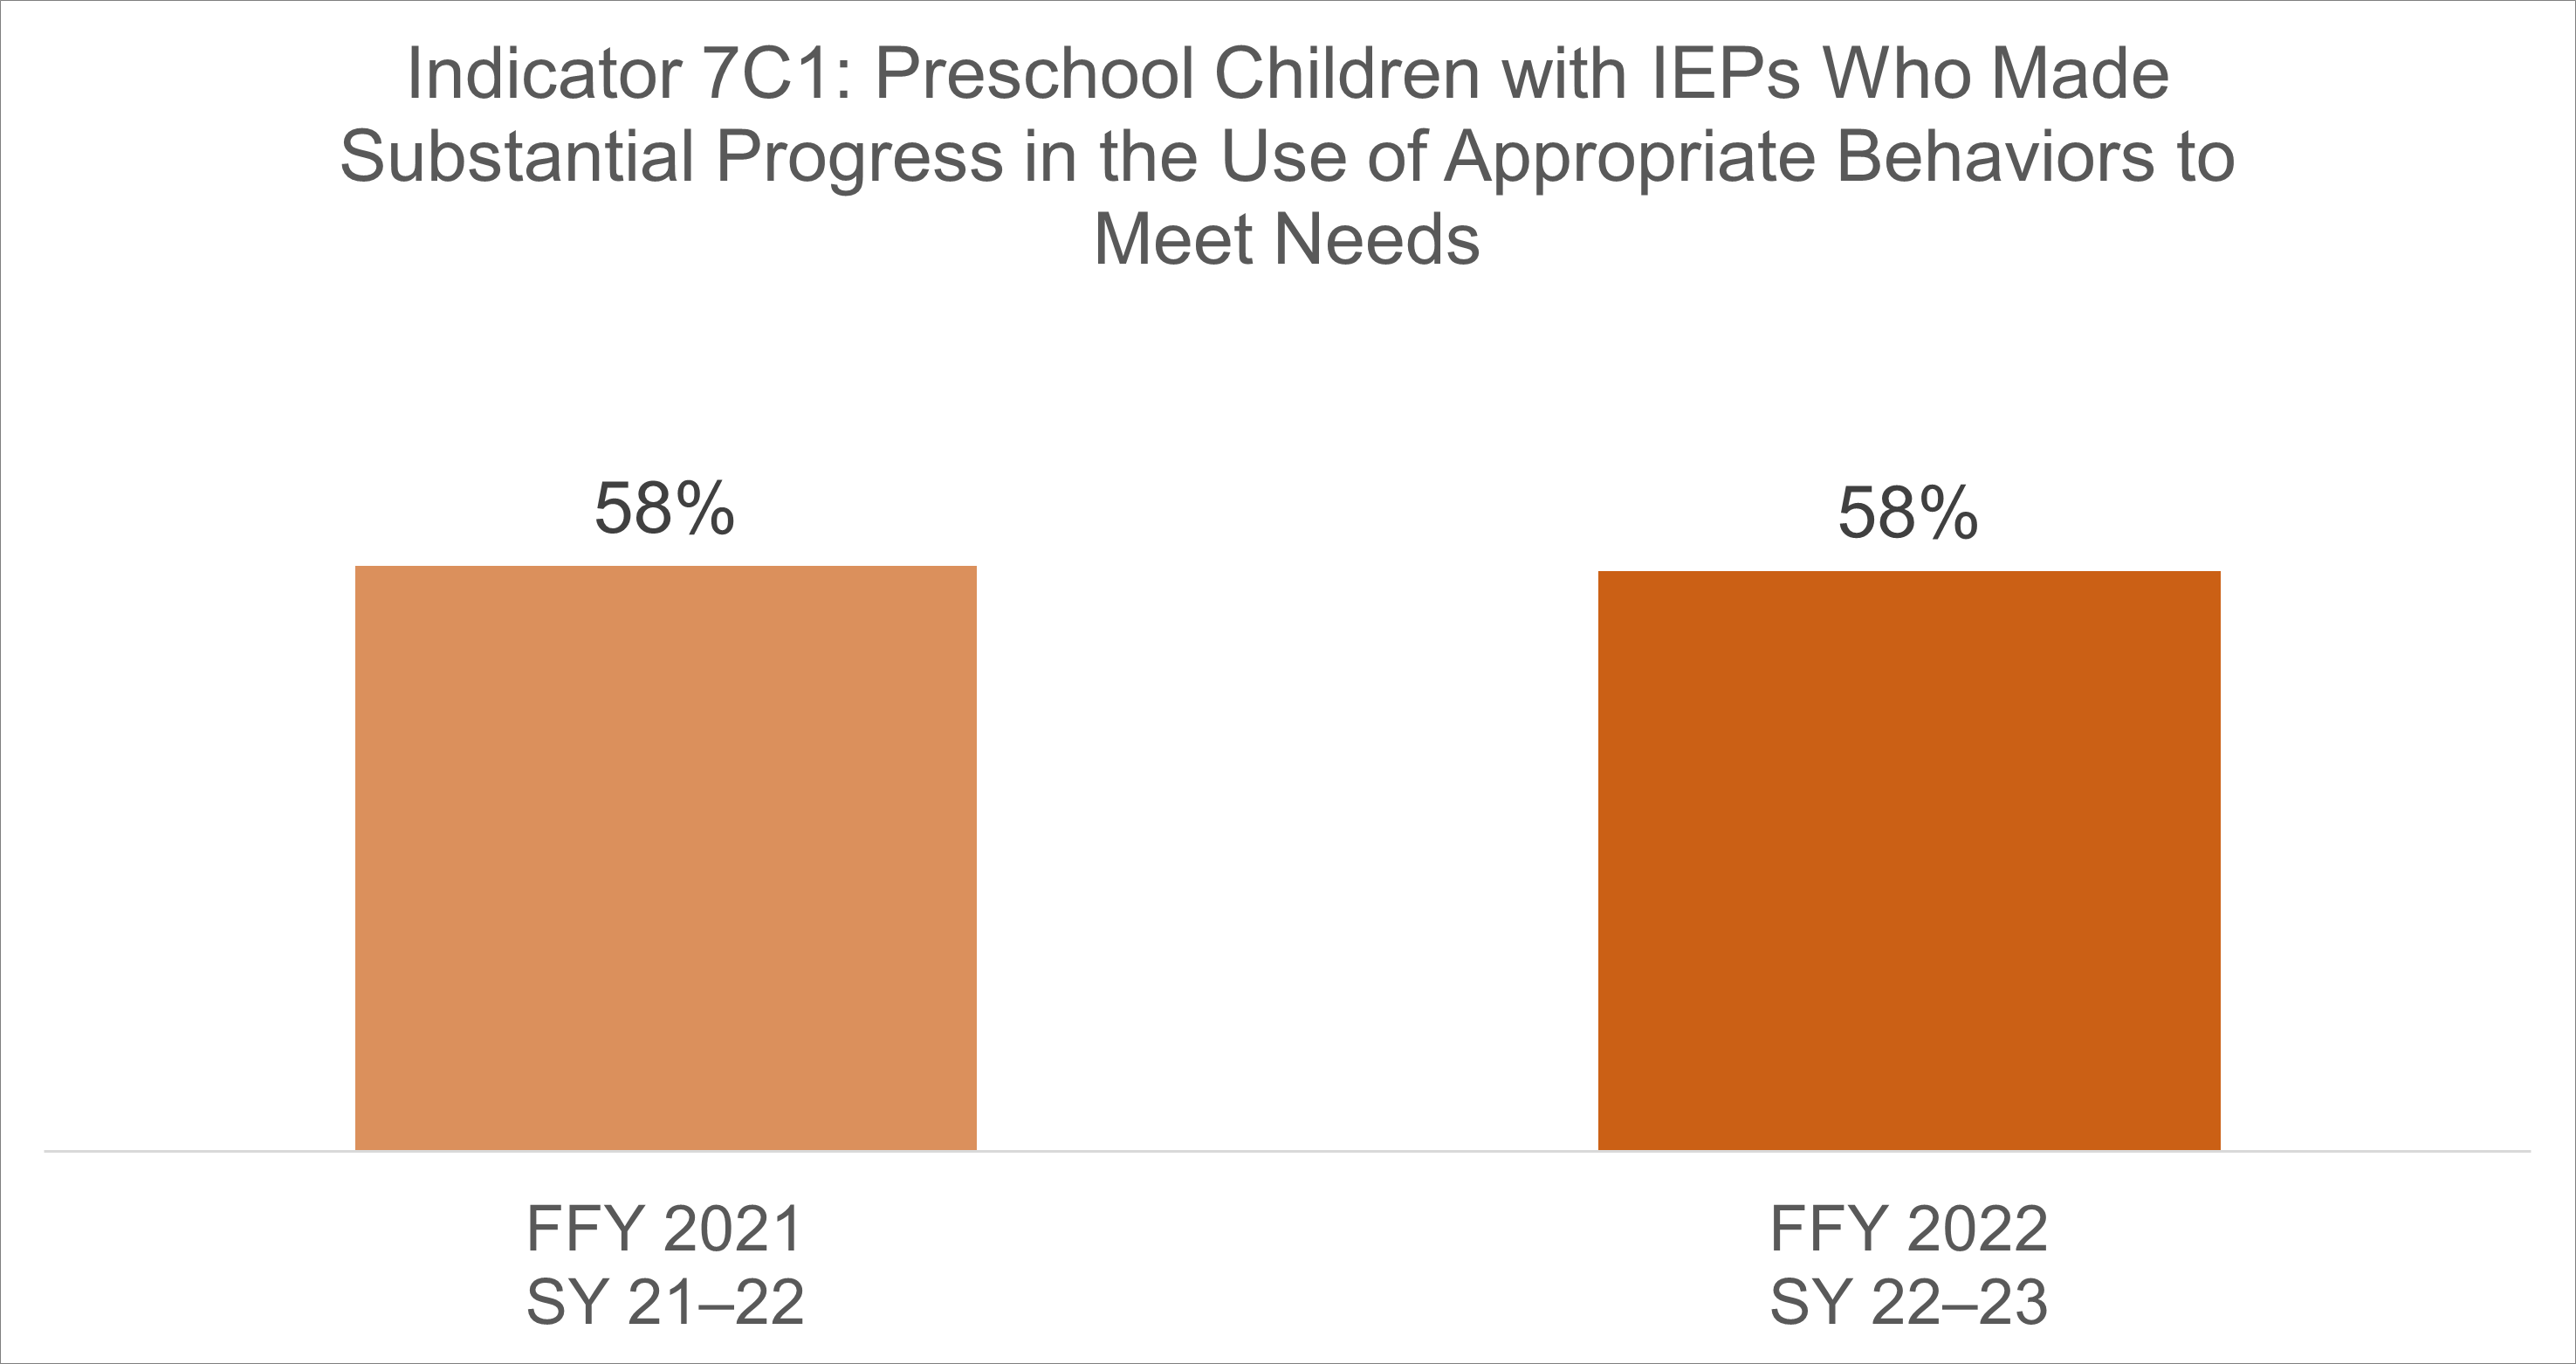
Indicator 7C1 FFY21 FFY22 (v2).png
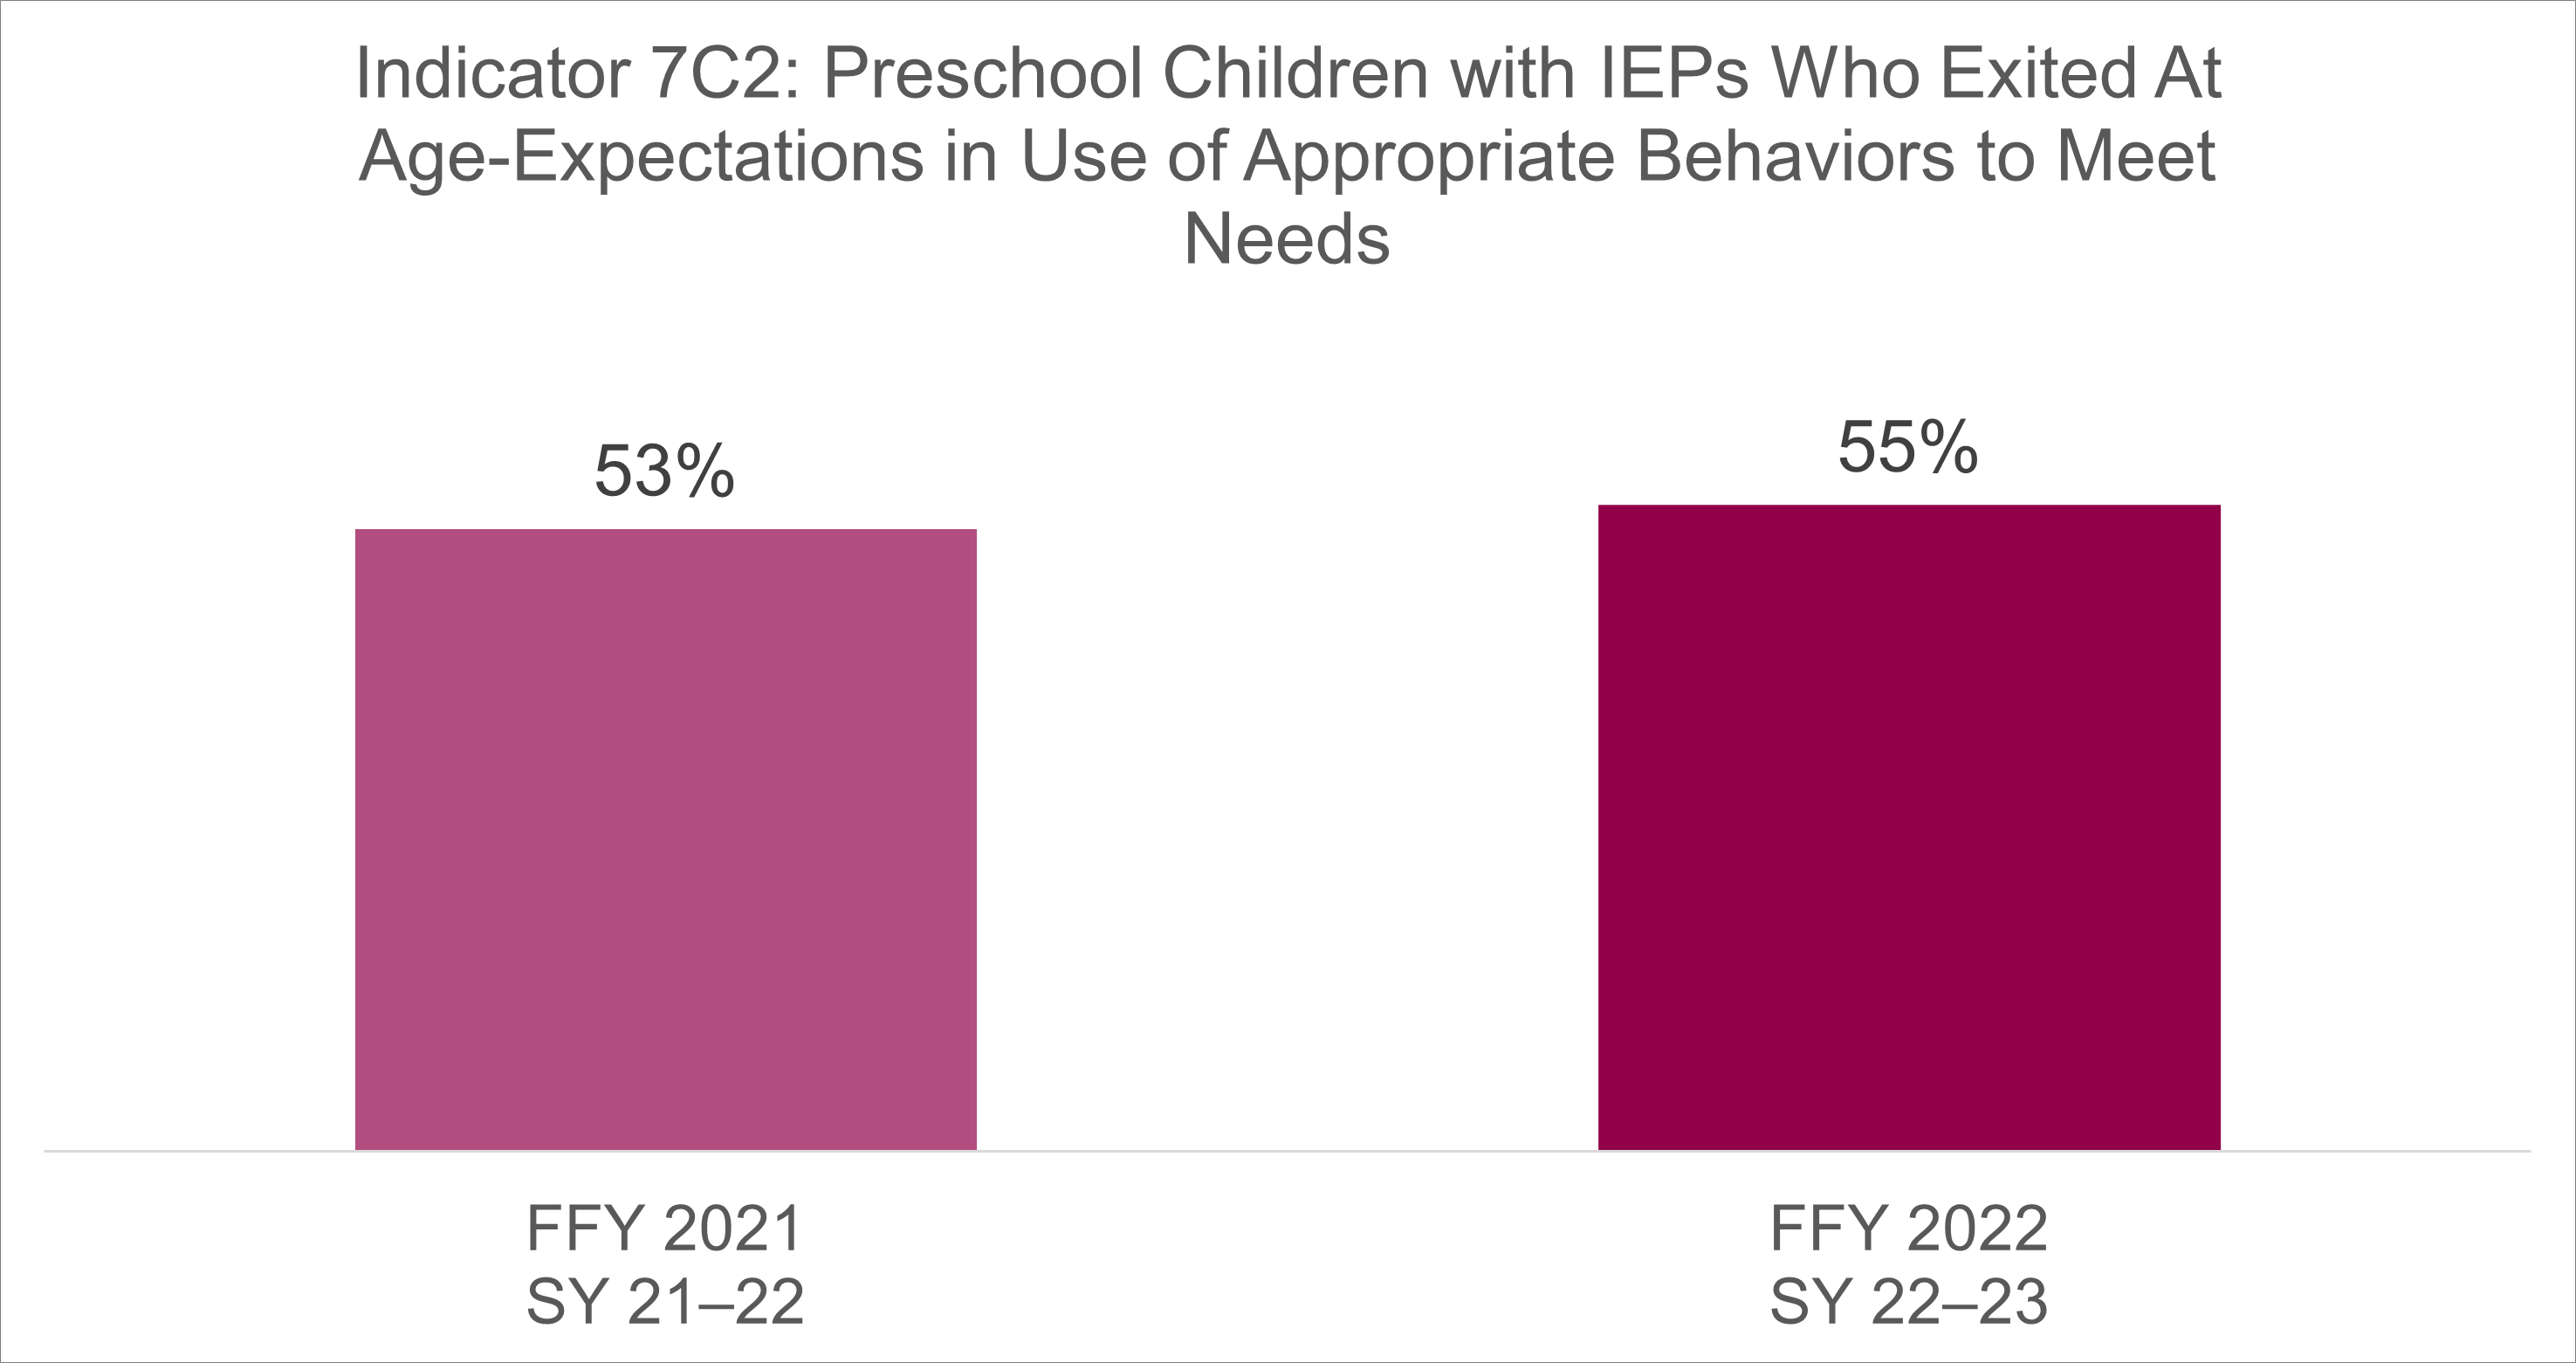
Indicator 7C2 FFY21 FFY22
Federal Fiscal Year (FFY)20212022
Data from School Year (SY)2021–20222022–2023
7C158%58%
7C253%55%

More Information

Arizona's Early Childhood Special Education web page

Questions or comments can be emailed to the ESS Operations inbox.

< Indicator 6SPP/APR HOMEIndicator 8 >

Indicator 6: Preschool Environments

Indicator 6: Preschool Environments

What Indicator 6 Is

Indicator 6 collects information for children with IEPs, ages 3–5, who are enrolled in a preschool program. The indicator looks at how much school time during which students with IEPs are in the same classroom as students without disabilities. It also looks at how many children receive their special education services in the home.

Why Indicator 6 Is Important

Indicator 6 shows us which Public Education Agencies (PEAs) may need help to improve inclusive teaching and learning. The goal of this indicator is to analyze the data so that we can improve student outcomes. A student with an IEP who is in regular classes has more opportunity for the same schoolwork and learning standards that all students have. Inclusive practices are essential in education because every student deserves to experience and learn in an atmosphere of respect, where they can develop and maintain friendships in their schools and communities. 

How Indicator 6 Is Measured

Within Indicator 6, there are three education settings for preschool children ages 3 through 5 with IEPs:

  1.  6A. Inside the regular class 80% or more of the day
  2.  6B. Inside the regular class less than 40% of the day
  3.  6C. In separate schools, residential facilities, or home-bound/hospital placements

How Indicator 6 Is Measured

Within Indicator 6, there are three education settings for students with IEPs, ages 3–5 who are enrolled in a preschool program:

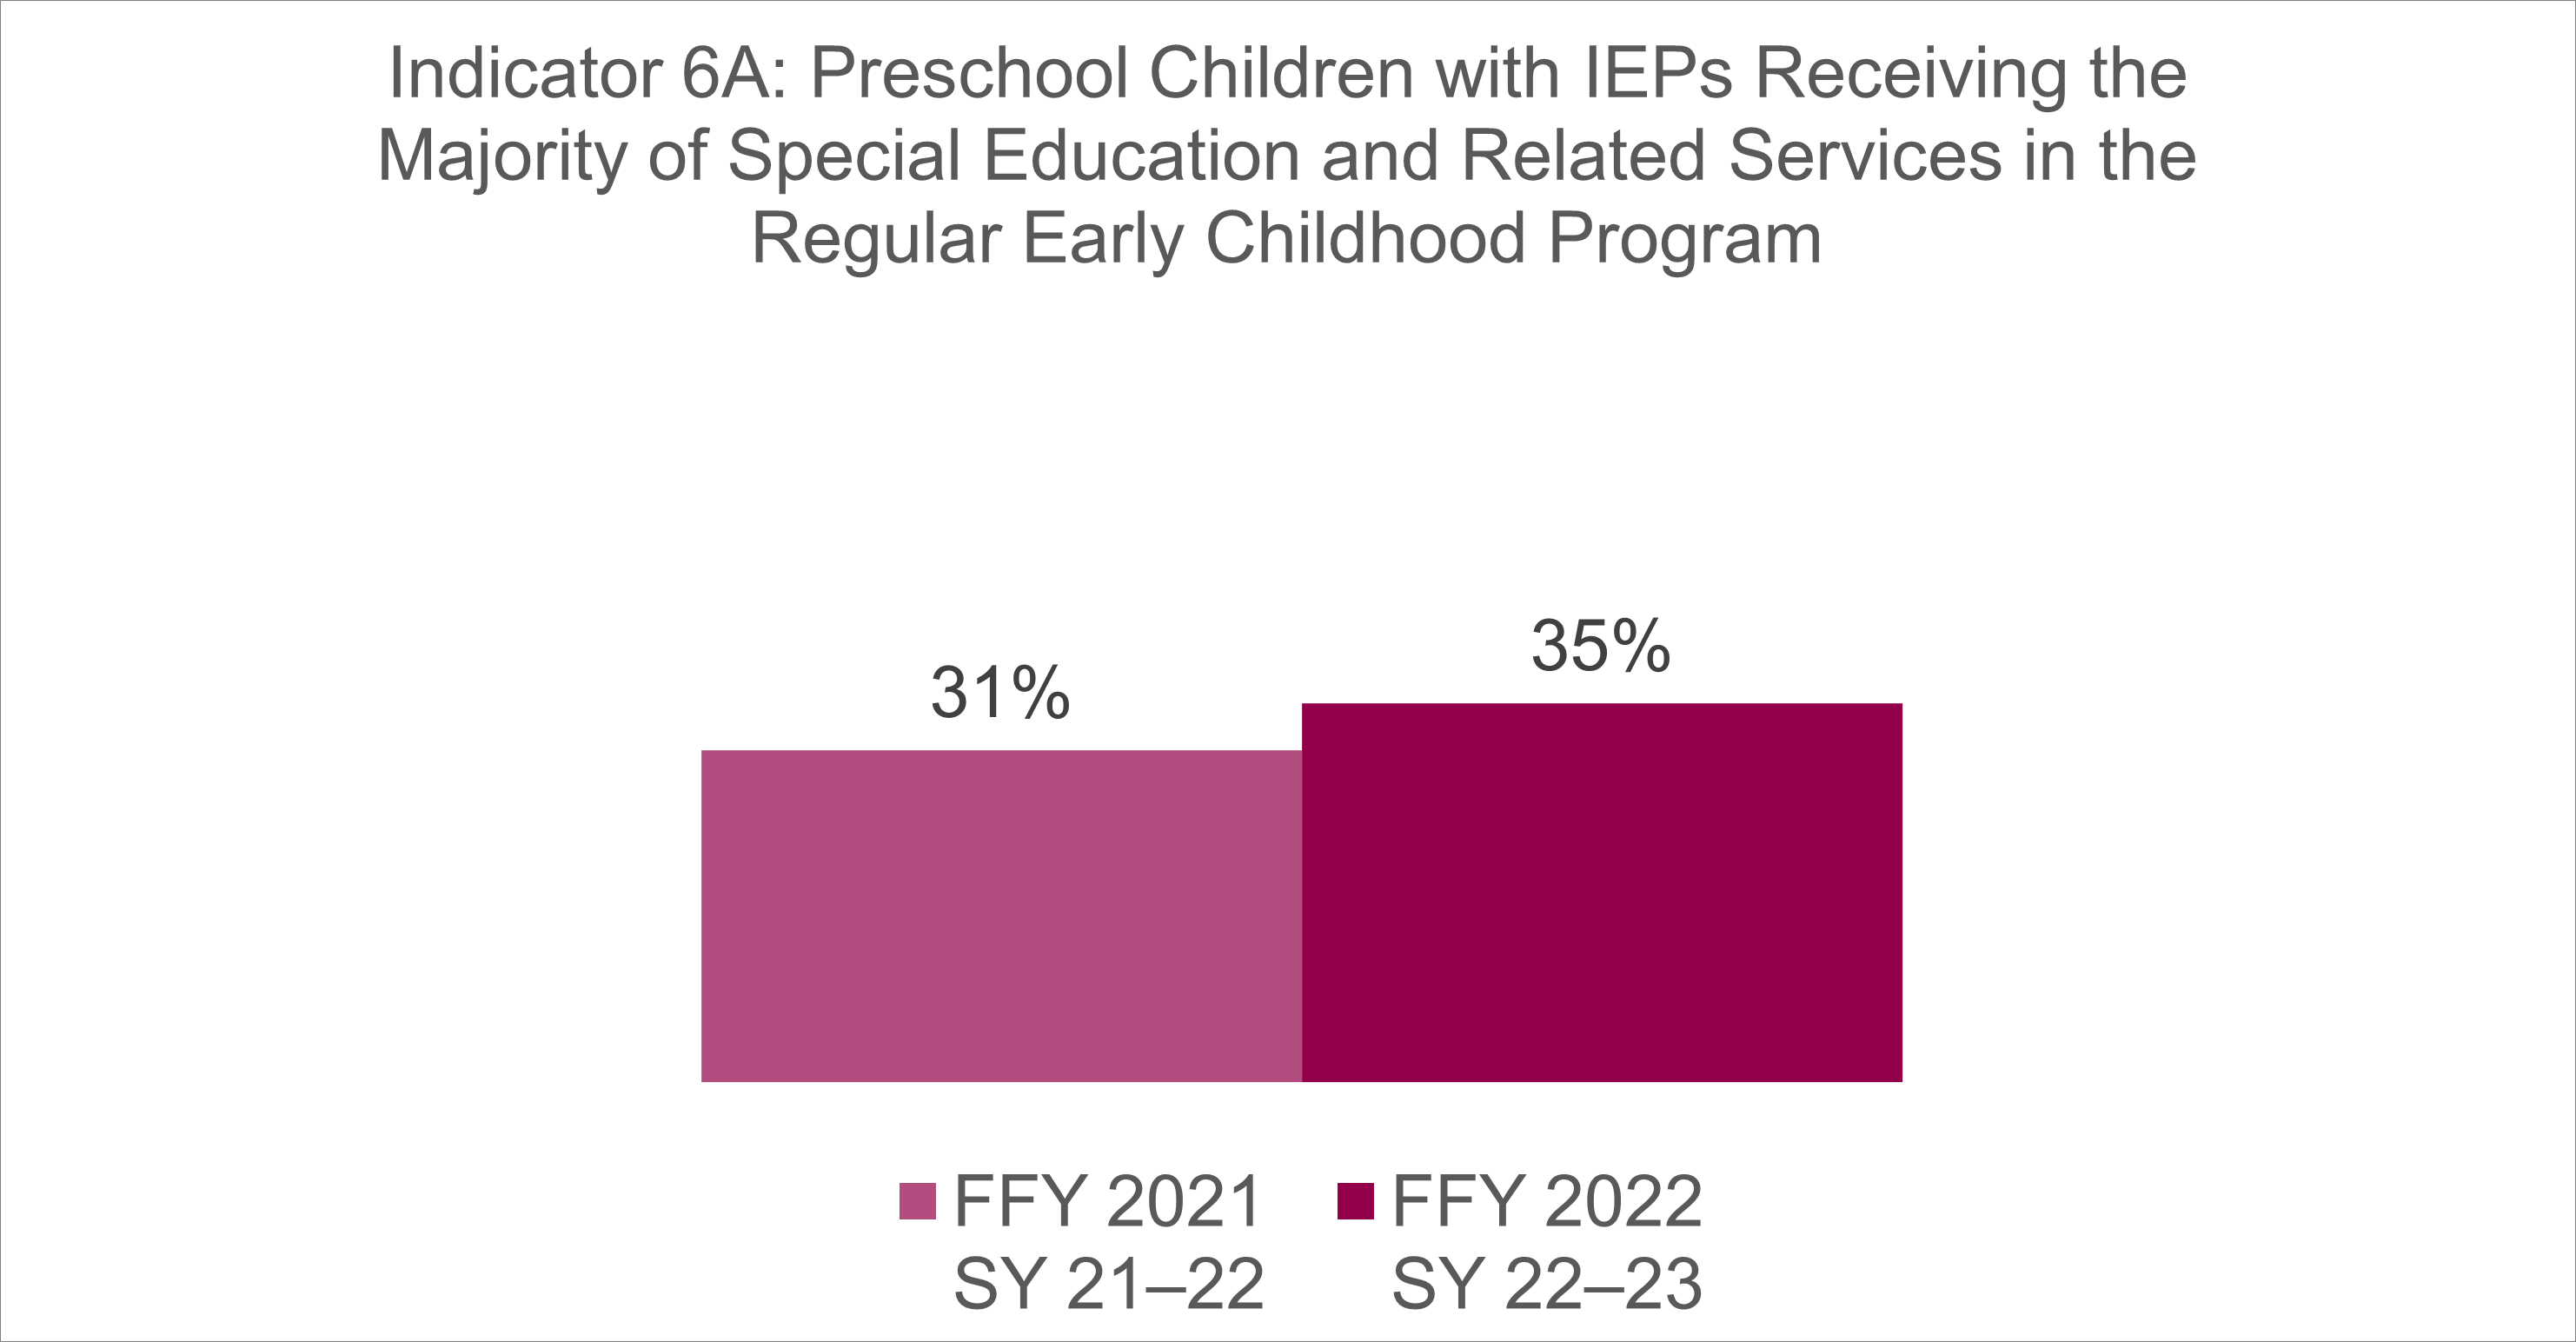
  1. 6A. Attending a regular early childhood program and receiving the majority of special education and related services in the regular early childhood program
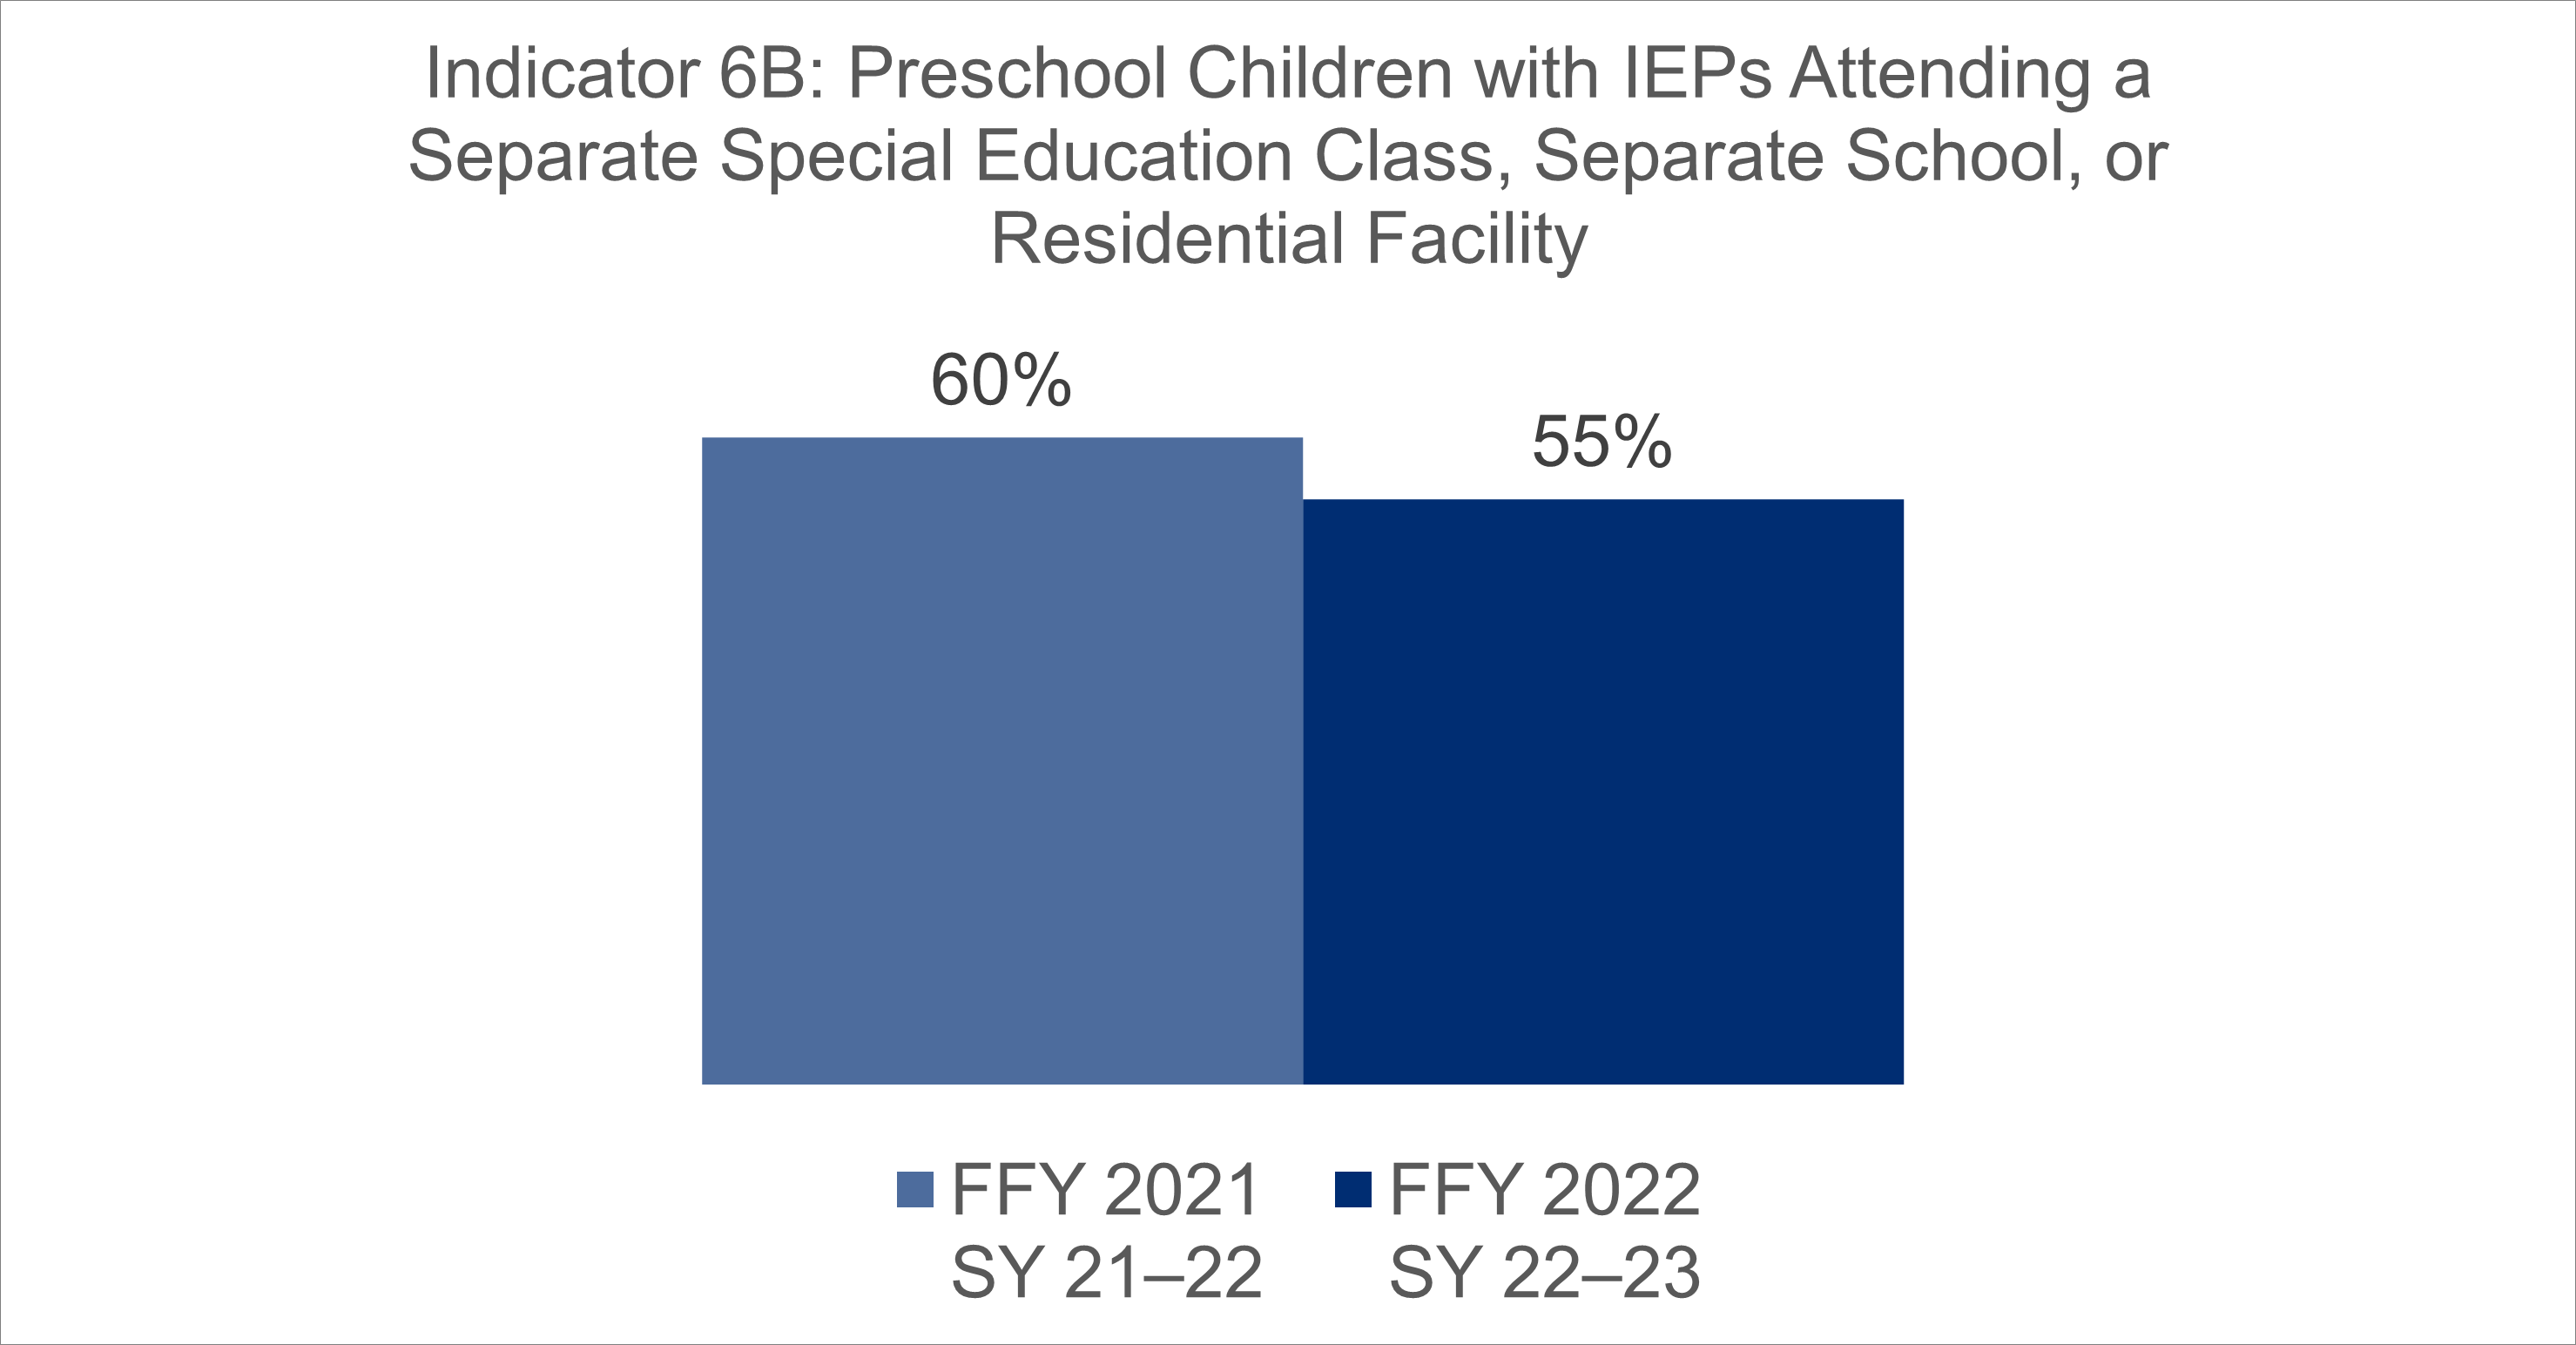
  2. 6B. Attending a separate special education class, separate school, or residential facility
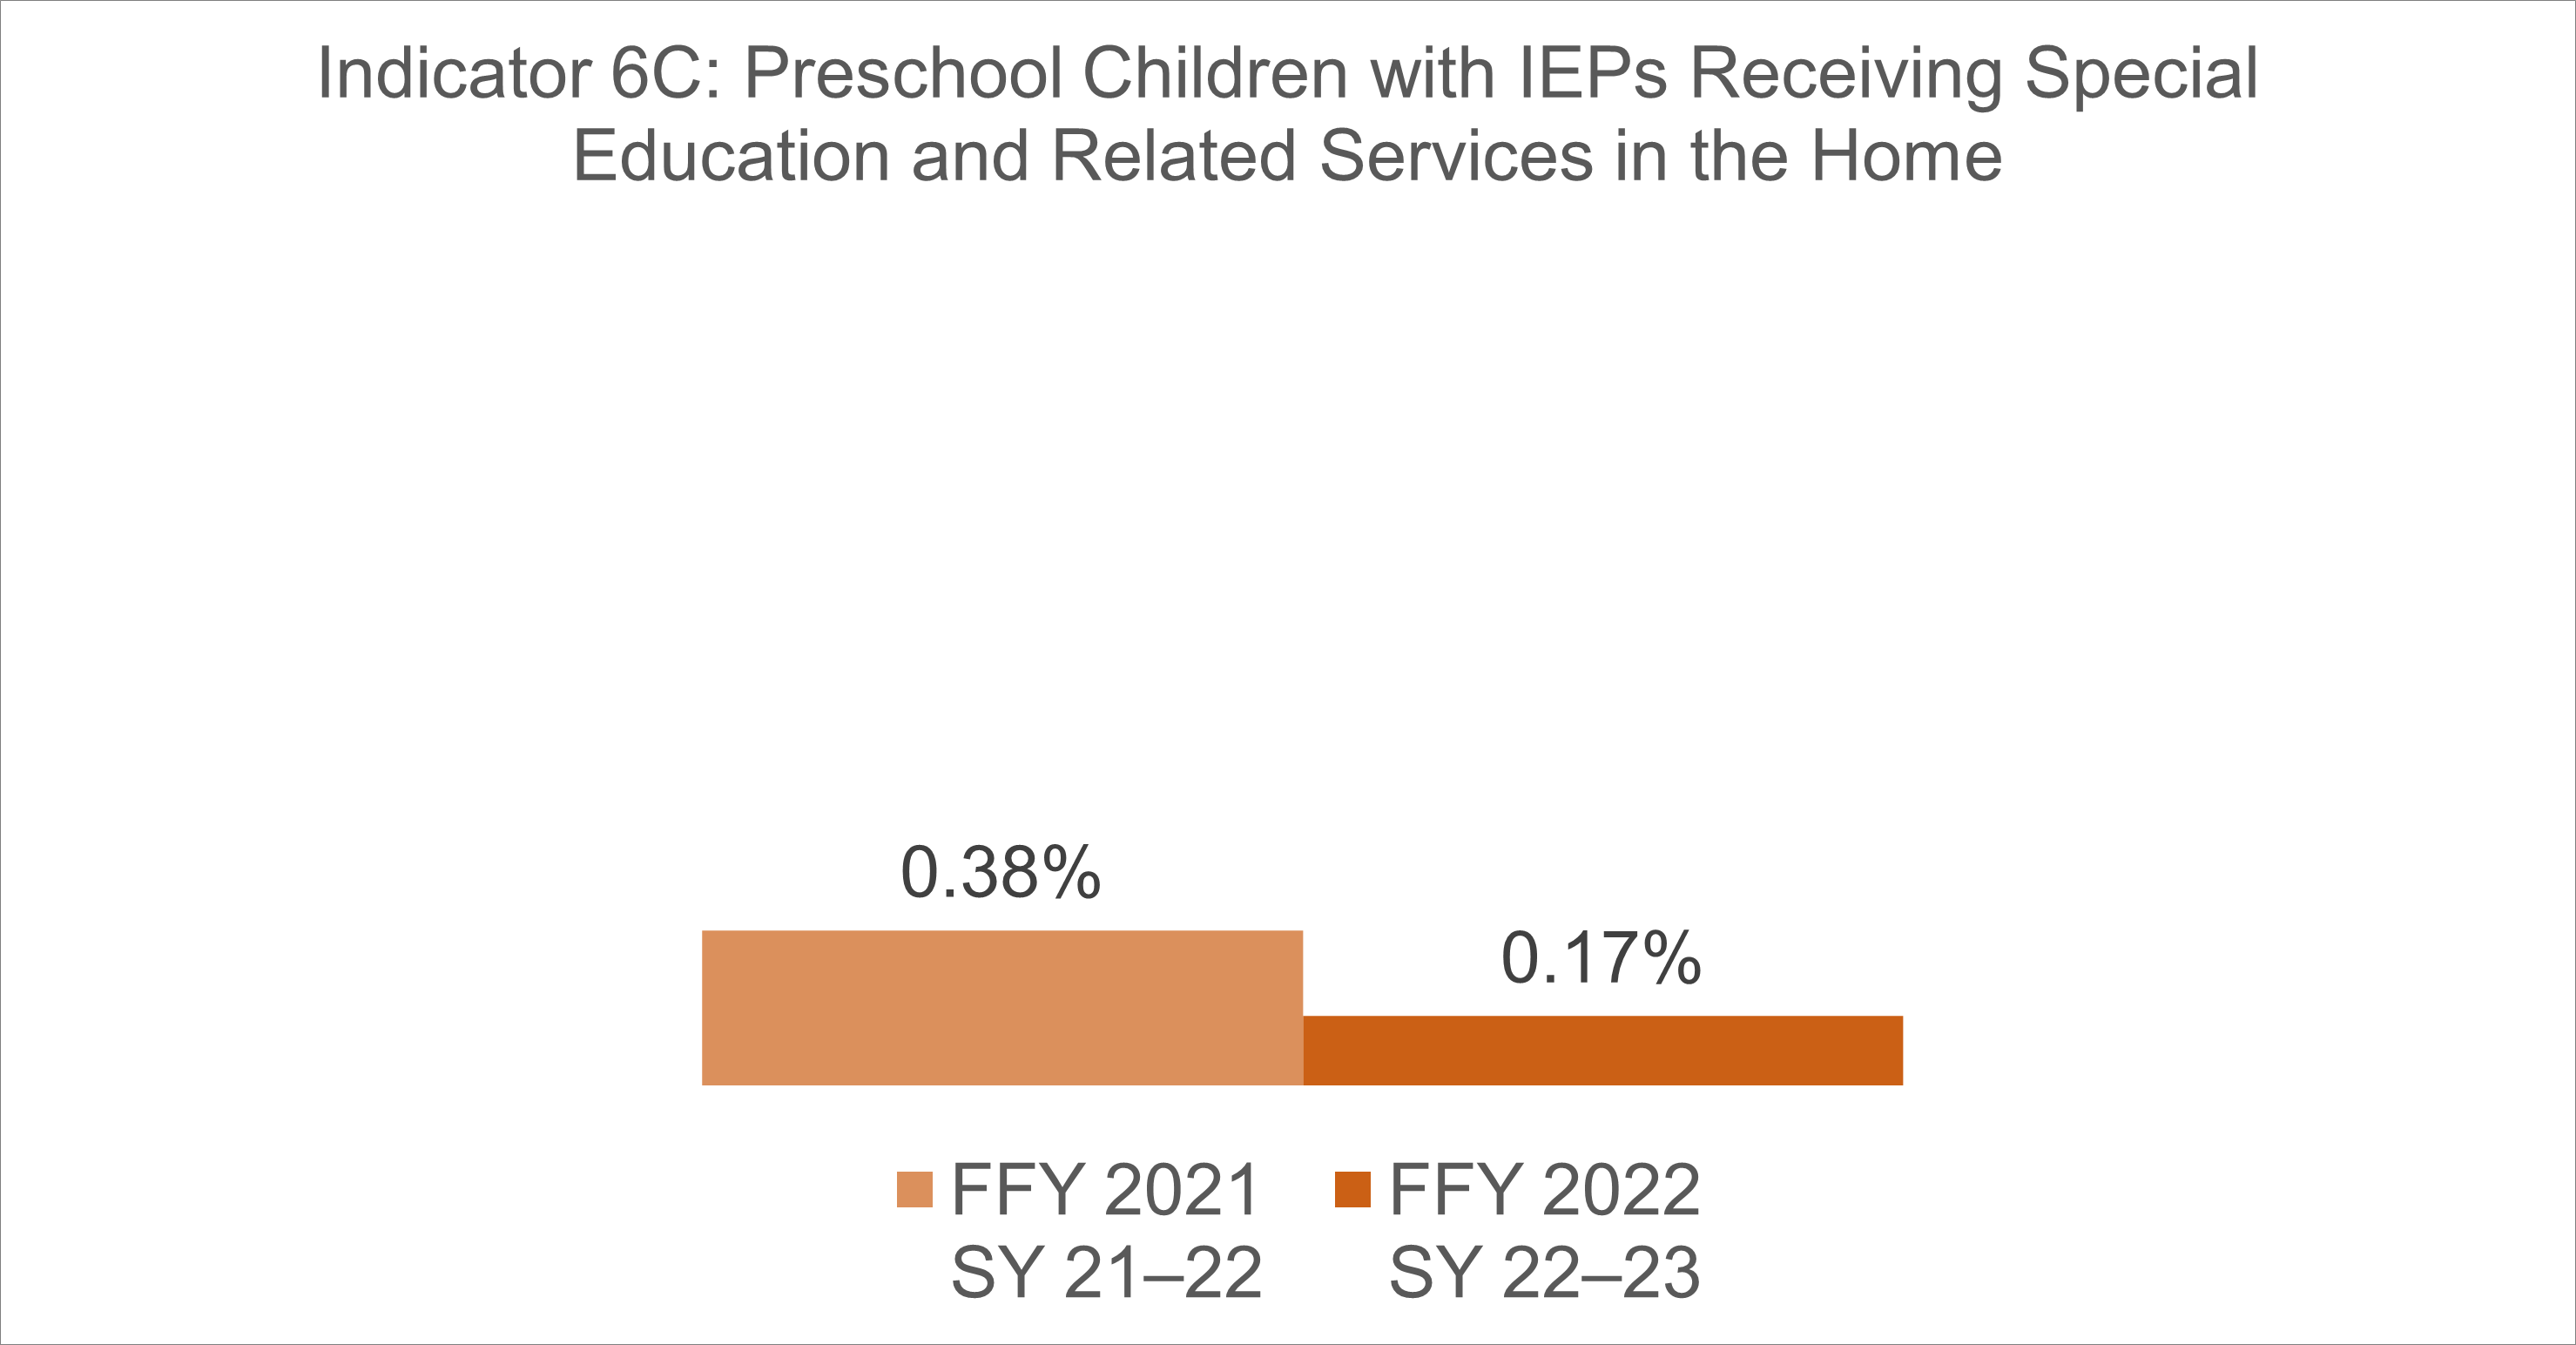
  3. 6C. Receiving special education and related services in the home

Data for Indicator 6

Indicator 6a Graph FFY21 FFY22.png
Indicator 6b Graph FFY21 FFY22.png
Indicator 6c Graph FFY21 FFY22.png
Federal Fiscal Year (FFY)20212022
Data from School Year (SY)2021–20222022–2023
6A31%35%
6B60%55%
6C0.38%0.17%

More Information

Arizona's Early Childhood Special Education web page

Questions or comments can be emailed to the ESS Operations Inbox.

< Indicator 5SPP/APR HOMEIndicator 7 >

Indicator 5: Education Environments (Ages 6–21) 

Indicator 5: Education Environments (Ages 6–21) 

What Indicator 5 Is

Indicator 5 collects information for children who are age 5 in kindergarten through age 21. It looks at how much school time during which students with IEPs are in the same classroom as students without disabilities. It also looks at how many students go to their local school or a separate school.

Why Indicator 5 Is Important

Indicator 5 shows us which Public Education Agencies (PEA) may need help to improve inclusive teaching and learning. The goal of this indicator is to analyze data so that we can improve student outcomes. A student with an IEP who is in regular classes has more opportunity for the same schoolwork and learning standards that all students have. Inclusive practices are essential in education because every student deserves to experience and learn in an atmosphere of respect, where they can develop and maintain friendships in their schools and communities. 

How Indicator 5 Is Measured

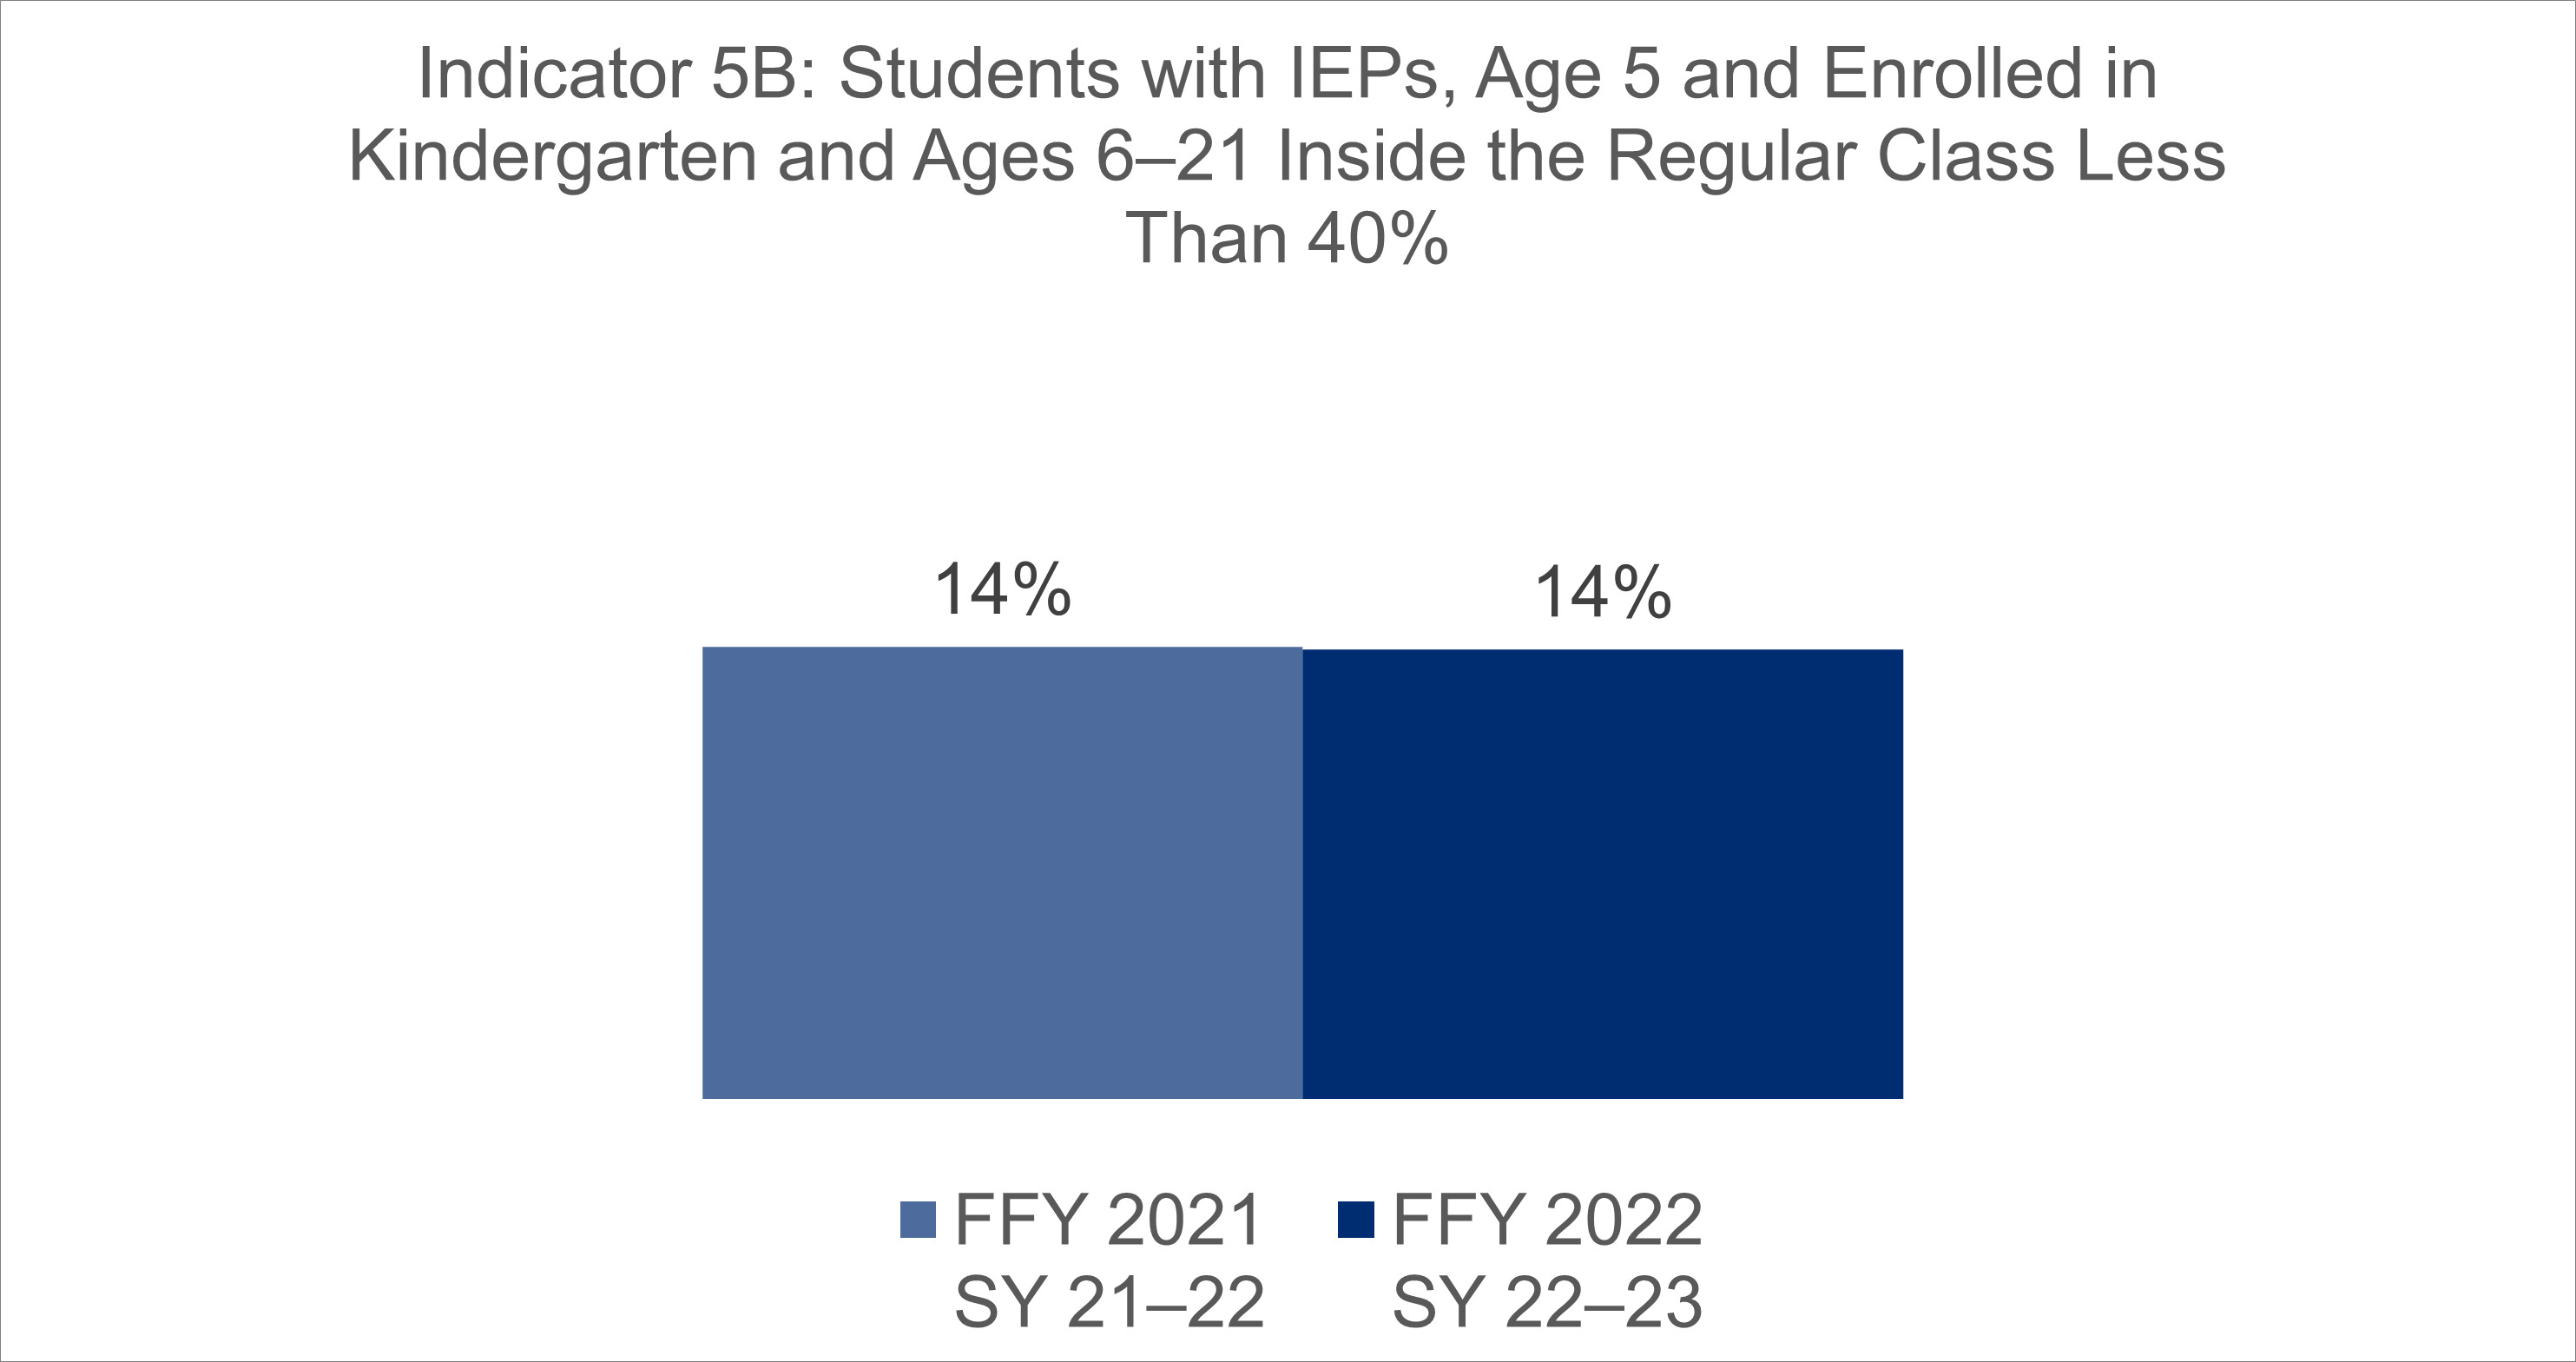
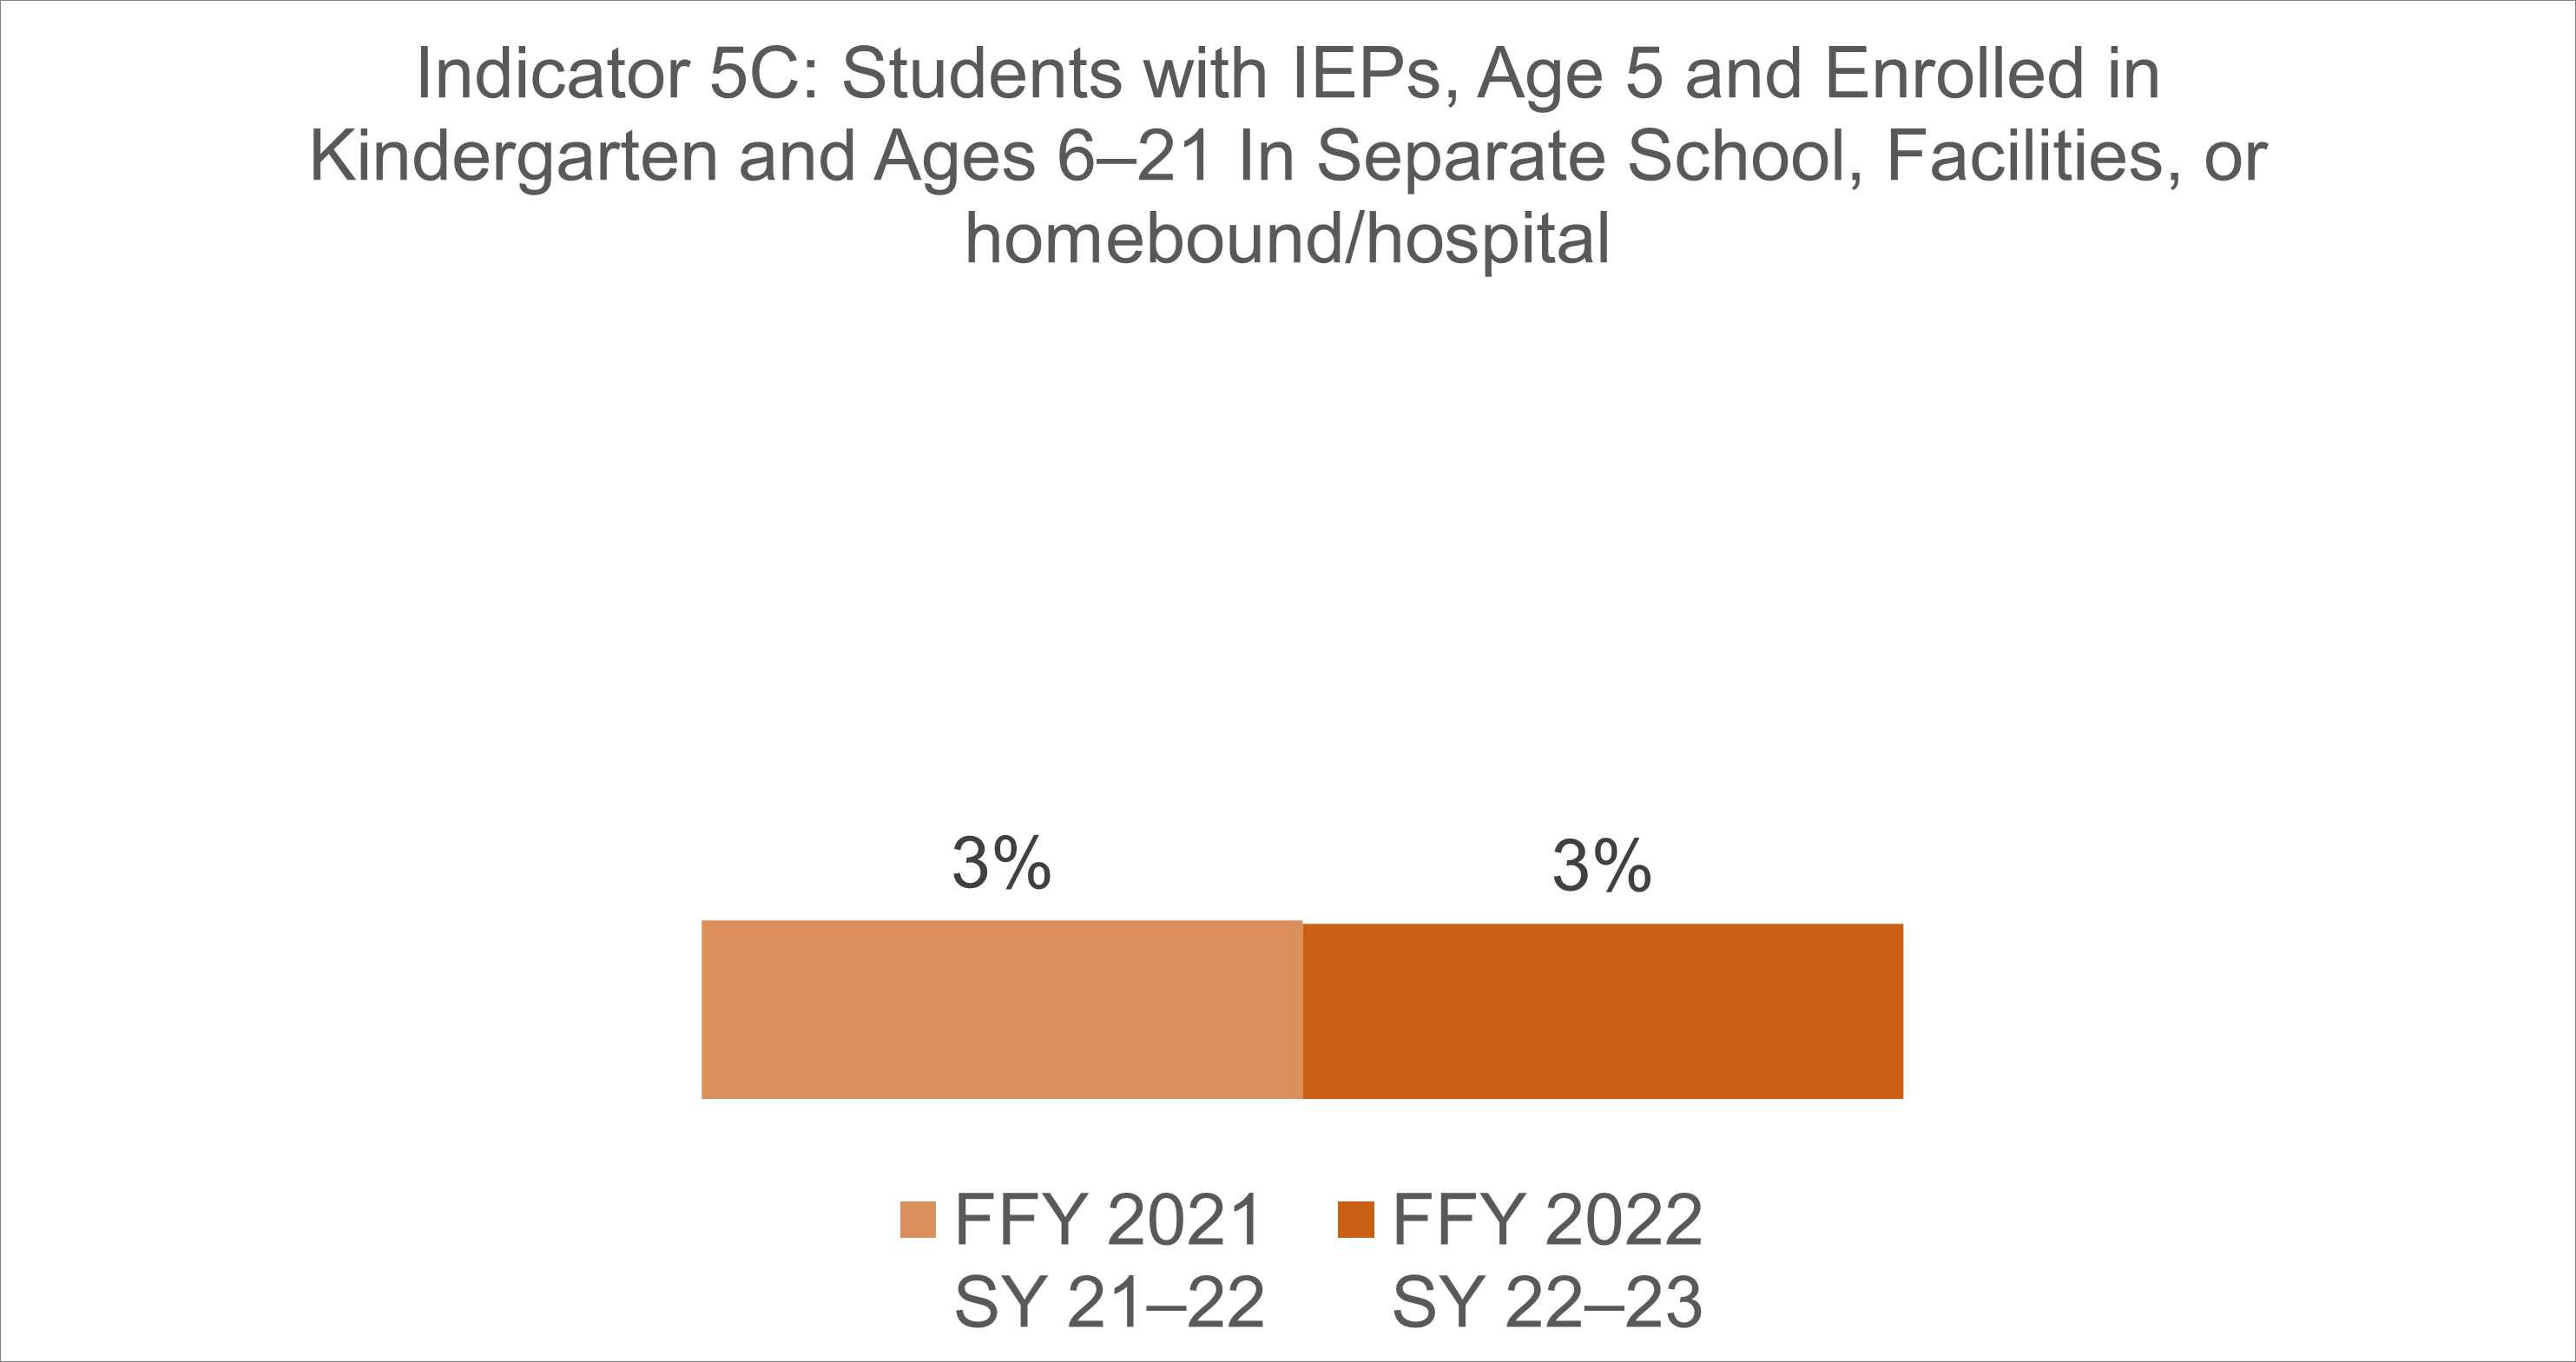
Within Indicator 5, there are three education settings for students with IEPs, age 5 and enrolled in kindergarten and ages 6–21:

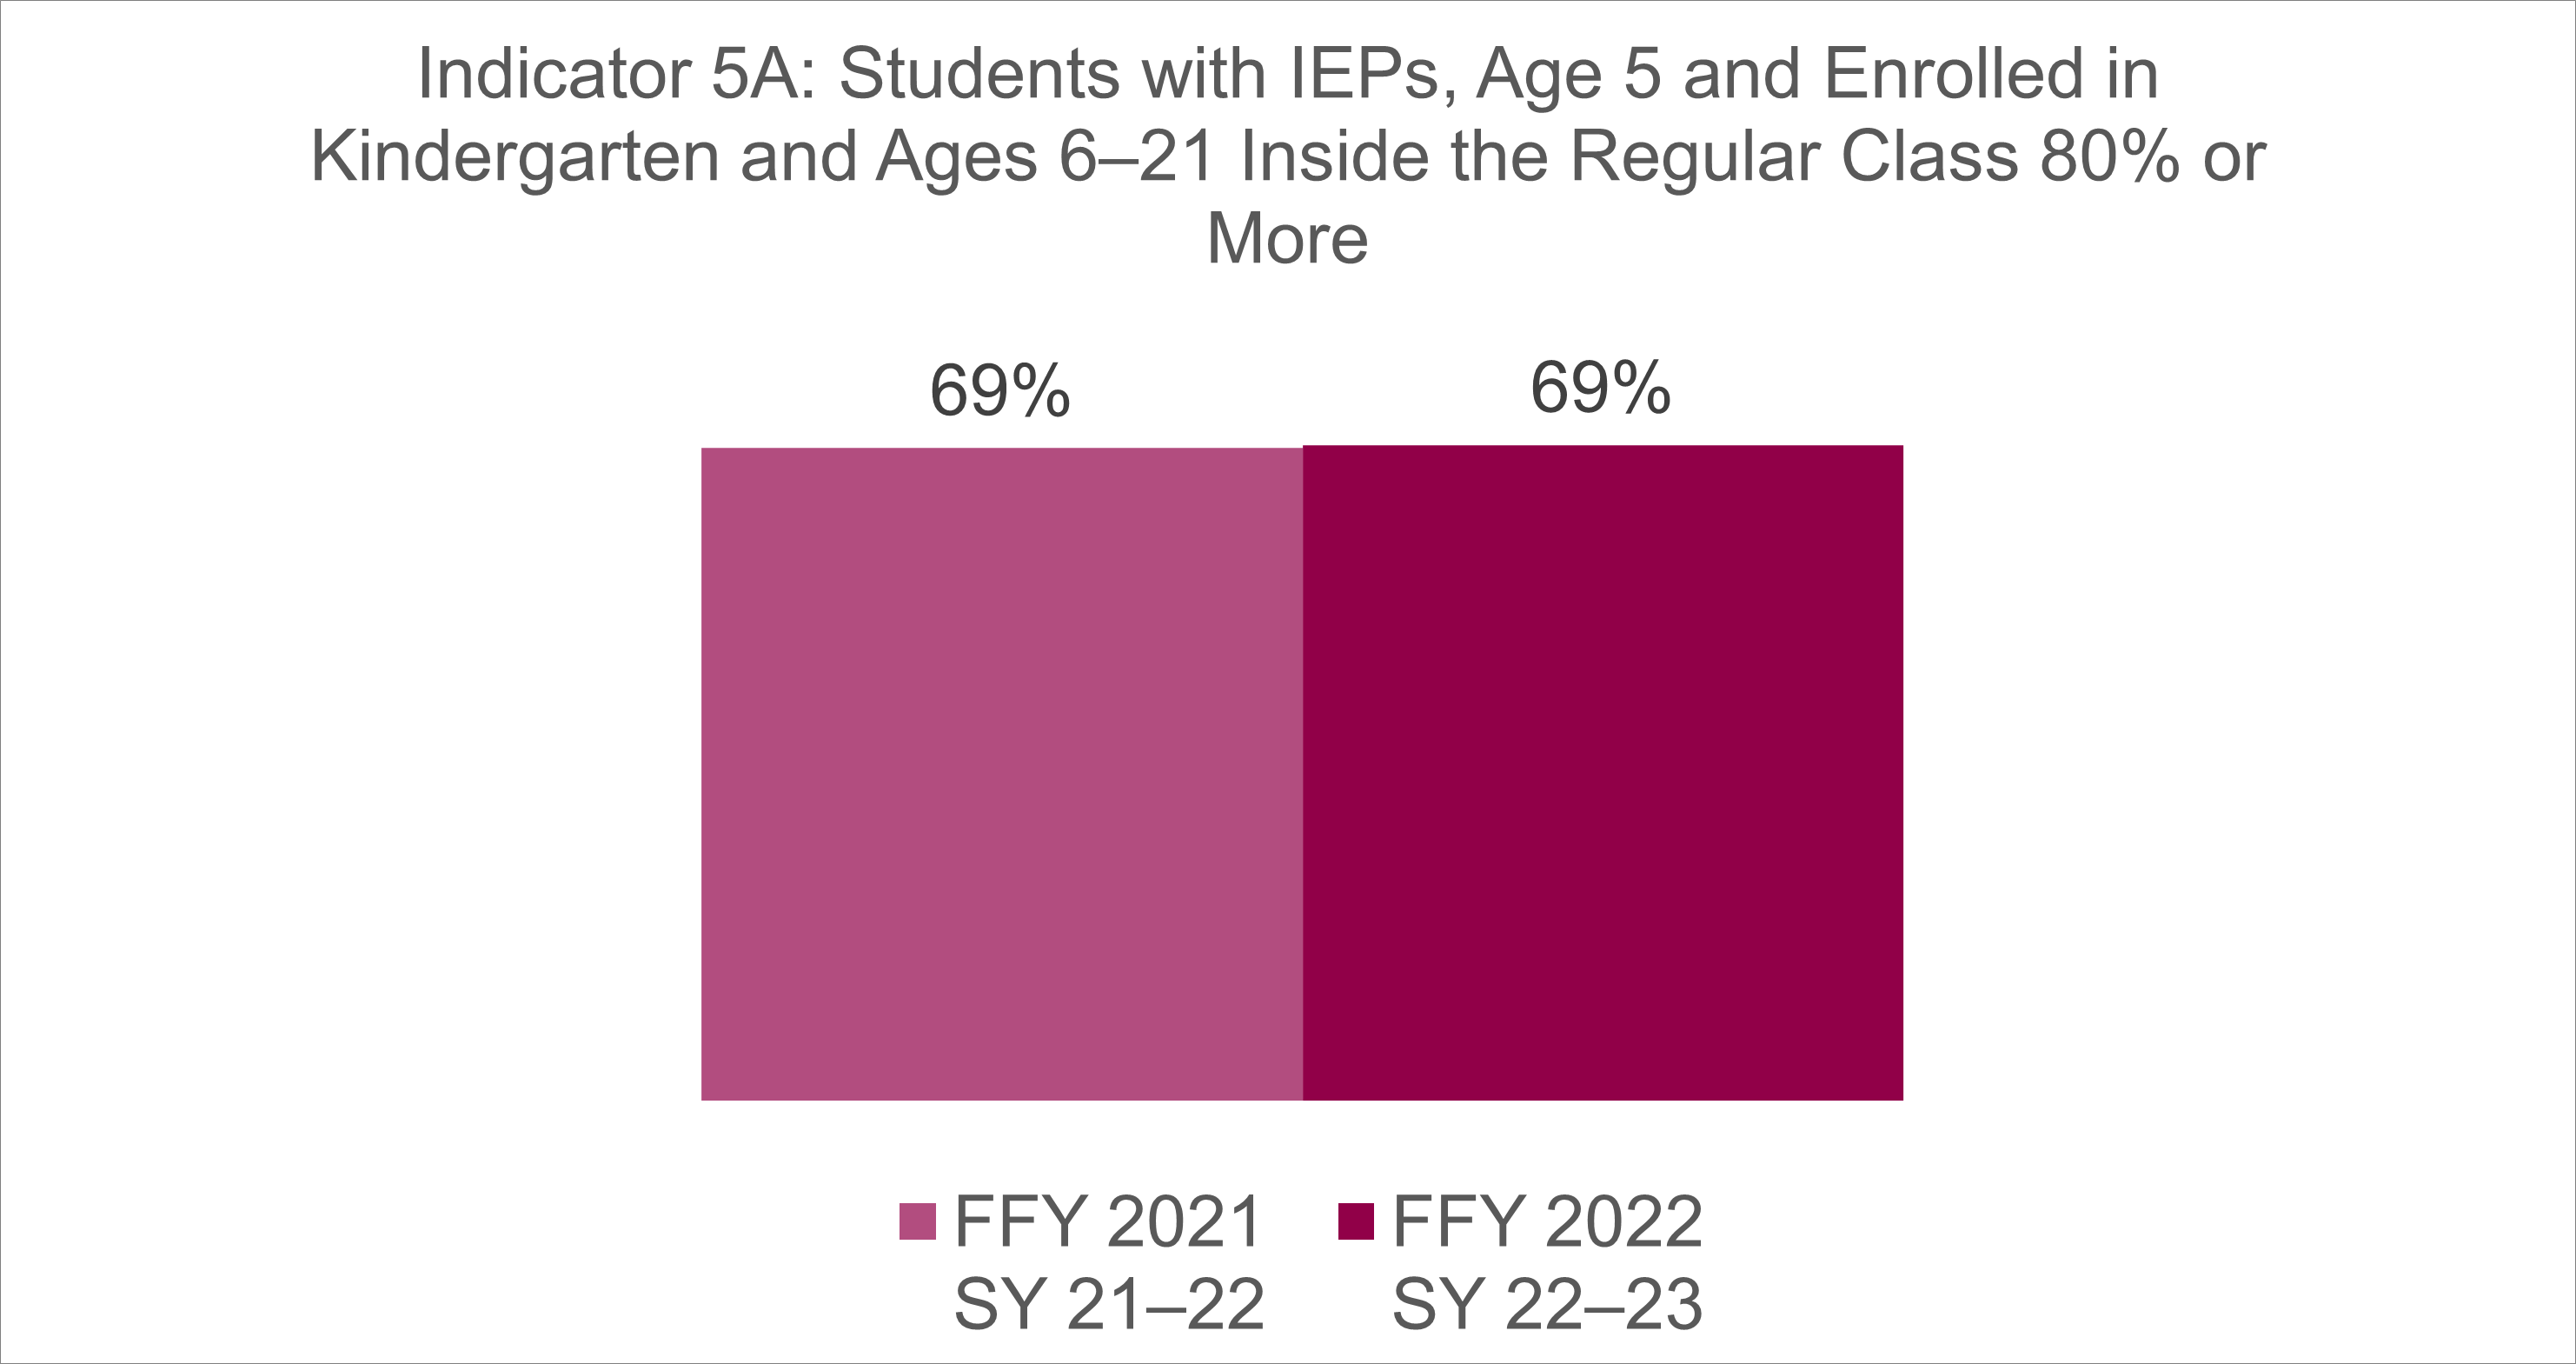
  1.  5A. Inside the regular class 80% or more of the day
  2.  5B. Inside the regular class less than 40% of the day
  3.  5C. In separate schools, residential facilities, or home-bound/hospital placements

Data for Indicator 5

Indicator 5A FFY21 FFY22.png
Indicator 5B Graph FFY21 FFY22.png
Indicator 5C Graph FFY21 FFY22.png
Federal Fiscal Year (FFY)20212022
Data from School Year (SY)2021–20222022–2023
5A69%69%
5B14%14%
5C3%3%

More Information

Questions or comments can be emailed to the ESS Operations inbox.

< Indicator 4SPP/APR HOMEIndicator 6 >

Indicator 4: Suspensions/Expulsions

Indicator 4: Suspensions/Expulsions

What Indicator 4 Is

Within Indicator 4, there are two separate measurements:

1. 4A looks at the Public Education Agency’s (PEA) rate of suspensions or expulsions for students with disabilities totaling 10 or more days compared to the State’s rate of suspensions or expulsions for students with disabilities totaling 10 or more days.

2. 4B looks at the same calcualation as 4A, however the calculation looks at the suspensions and expulsions by each racial/ethnic group.

Why Indicator 4 Is Important

Indicator 4 ensures PEAs have appropriate policies, procedures and practices regarding discipline for students with disabilities. 4B specificly looks at ensuring there aren't internal mechanisms in place that could lead to discipline predicated on race/ethnicity.

How Indicator 4 Is Measured

For indicator 4A, the PEA’s rate is calculated by dividing by the number of students with an IEP removed for 10 or more days by the total number of students with an IEP in the PEA. The State’s rate is calculated by dividing by the number of students with an IEP removed for 10 or more days in the State by the total number of students with an IEP in the Staet.  The rate ratio used to determine significant discrepancy is the PEAs’s rate divided by the State’s rate. 

Indicator 4B is similar to 4A, however the calculation is completed for members of each racial/ethnic group.

Data for Indicator 4

For indicator 4A, there were no PEAs in SY21-22 that were also identified in SY 20-21 and SY 19-20, therefore the data for indicator 4A is 0%.

For Indicator 4B, there was one PEA that was over the rate ratio of 2.0 for three consecutive years (SY21-22, SY20-21, and SY19-20). In order to be found as having a significant discrepancy in 4B, the PEA must also have policies, procedures, or practices that contribute to the significant discrepancy and do not comply with requirements relating to the development and implementation of IEPs, the use of positive behavioral interventions and supports, and procedural safeguards. The State will be conducting a review with this of this PEA.

More Information

Questions or comments can be emailed to the ESS Operations inbox.

< Indicator 3SPP/APR HOMEIndicator 5 >

Indicator 3: Assessment

Indicator 3: Assessment

What Indicator 3 Is

Indicator 3 reports the participation and performance of students with IEPs on statewide assessments. Arizona reports specifically on students with IEPs in grades 4, 8, and high school who have an IEP at the time of testing.

Why Indicator 3 Is Important

  • All students with and without IEPs are required to participate in a state's accountability system. This indicator sheds light on the on the gaps in proficiency data between students with IEPs and all students. Participation in assessments can lead to informed teaching and improved learning. Test results indicate where students have mastered a subject or where students need more help.

How Indicator 3 Is Measured

Within Indicator 3, there are four separate measurements:

  1.  3A measures the participation rate for children with IEPs
  2.  3B measures the proficiency rate for children with IEPs against grade-level academic standards
  3.  3C measures the proficiency rate for children with IEPs against alternate academic achievement standards
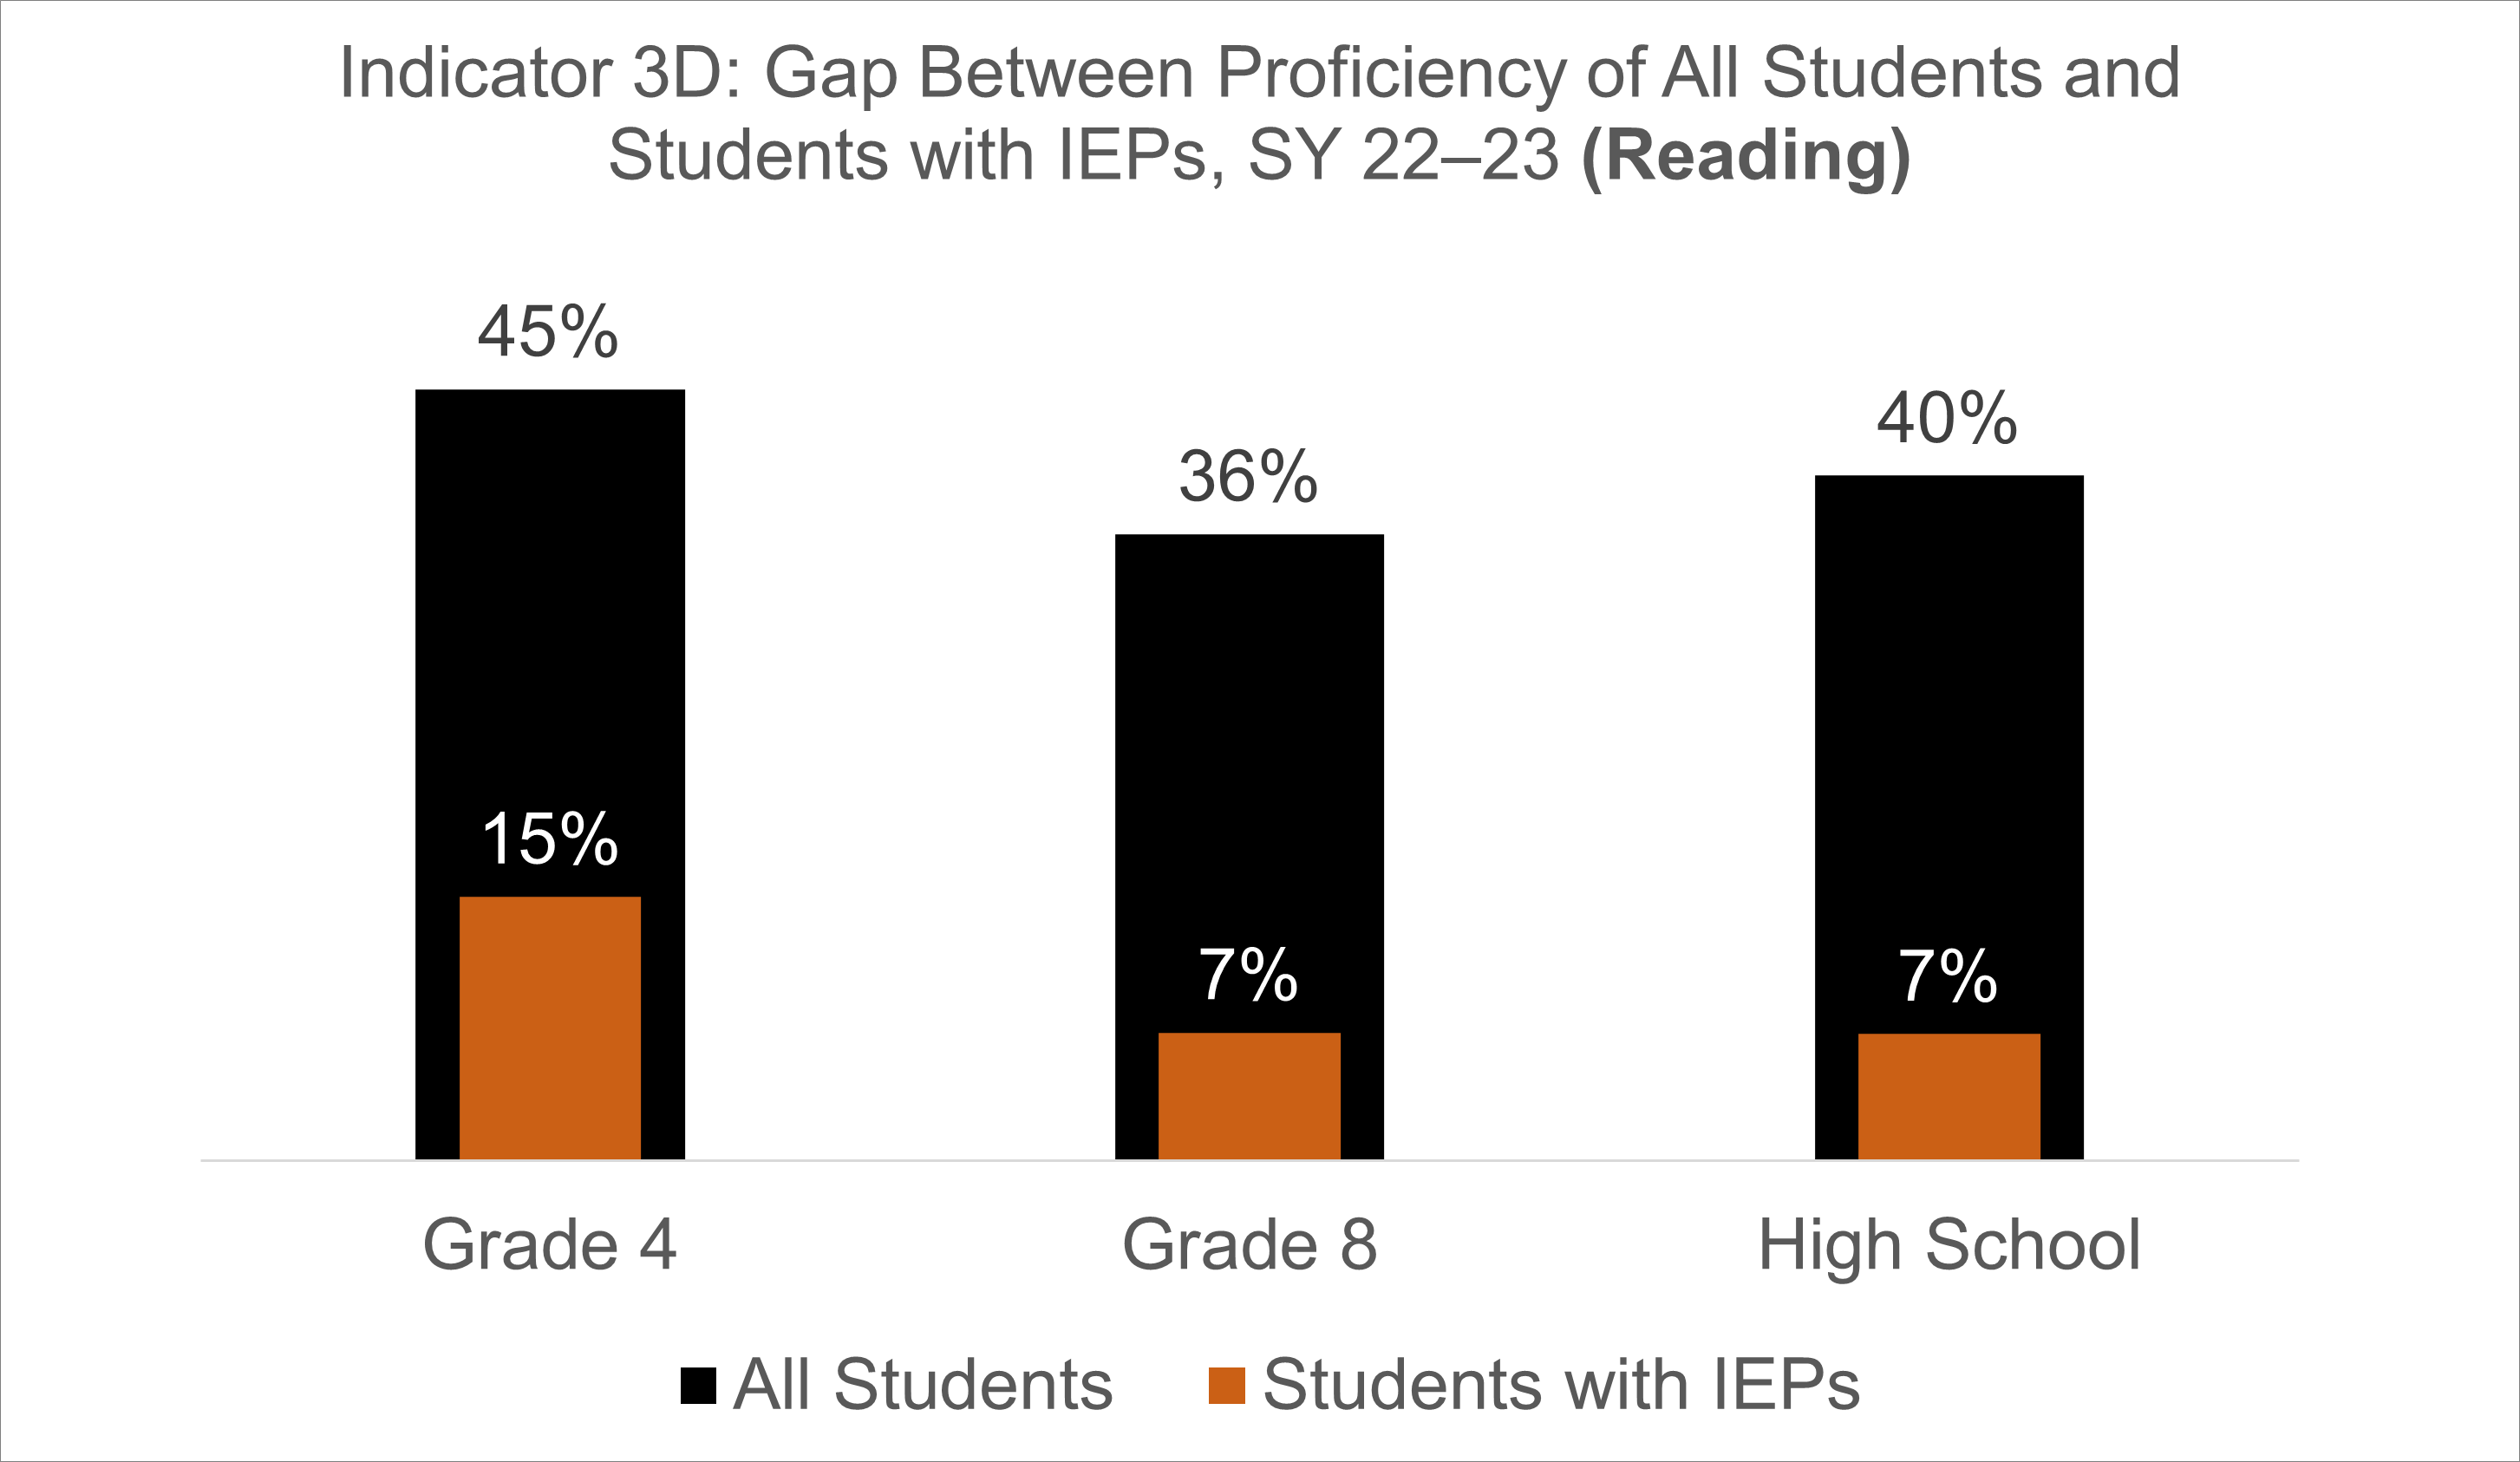
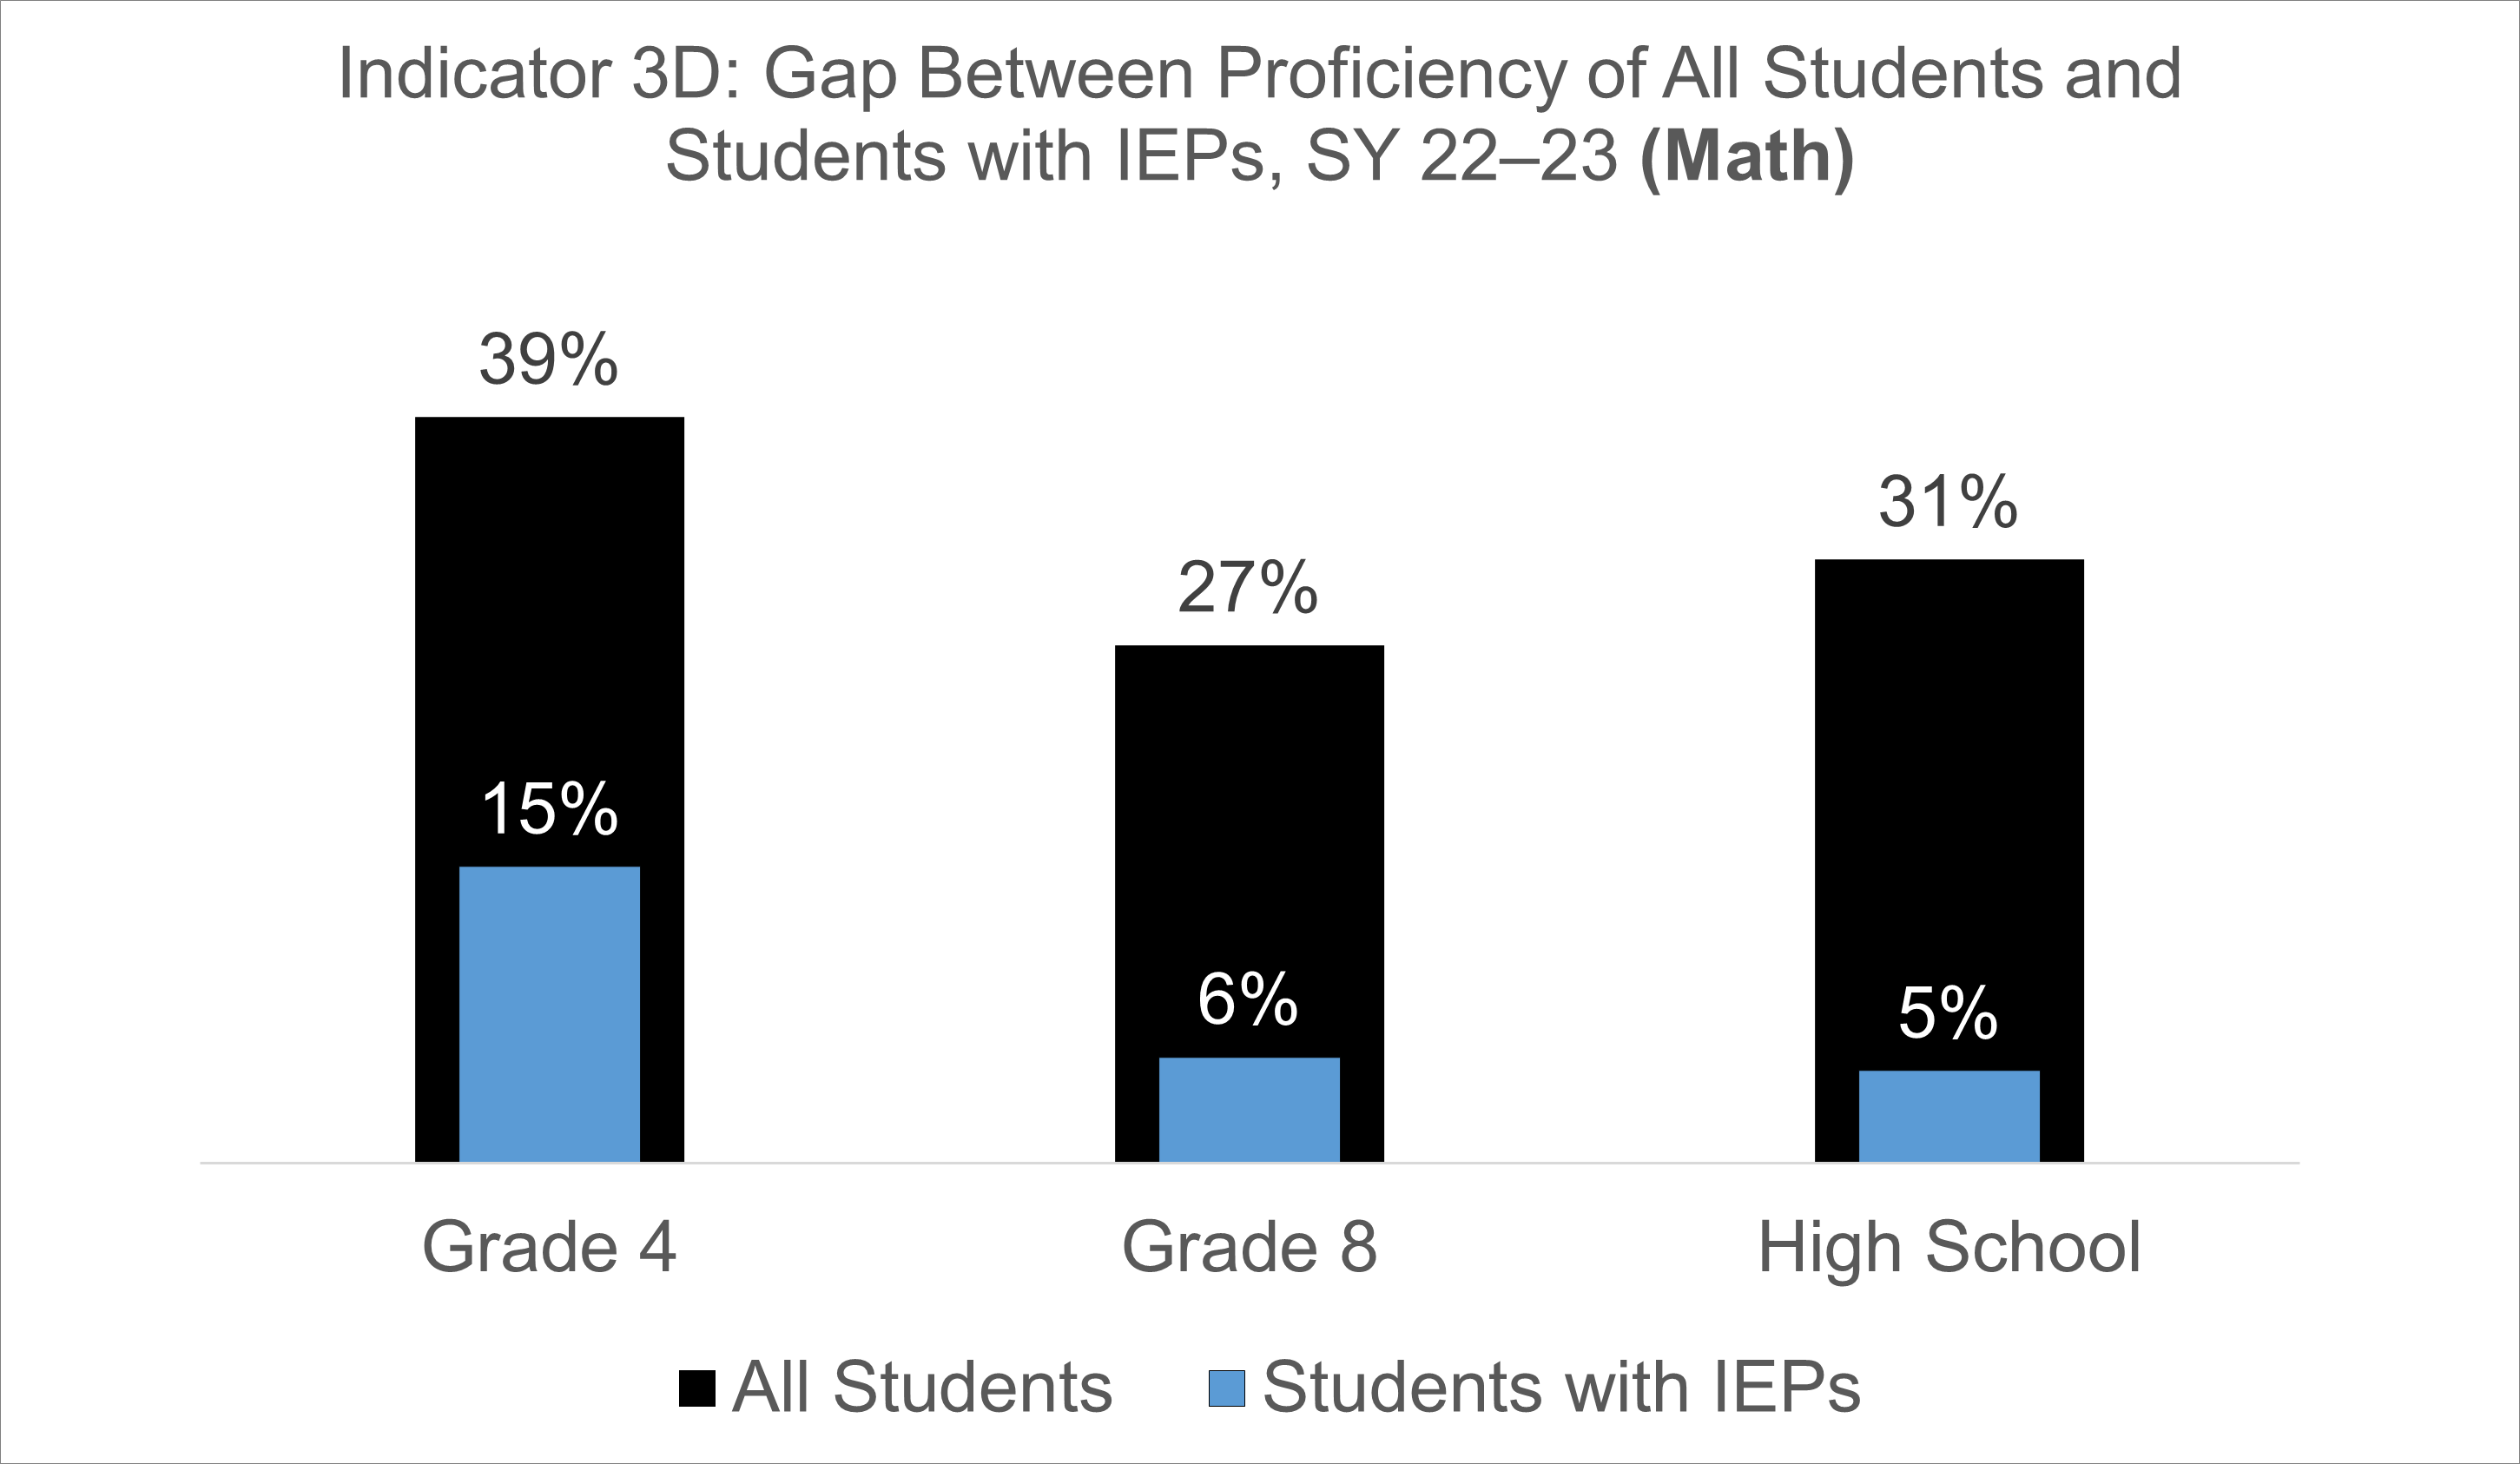
  4.  3D measures the gap in proficiency rates for children with IEPs and all students against grade-level academic achievement standards. The gap is found by subtracting the proficiency rate for children with IEPs from the proficiency rate for all children (with and without IEPs).

Data for Indicator 3A

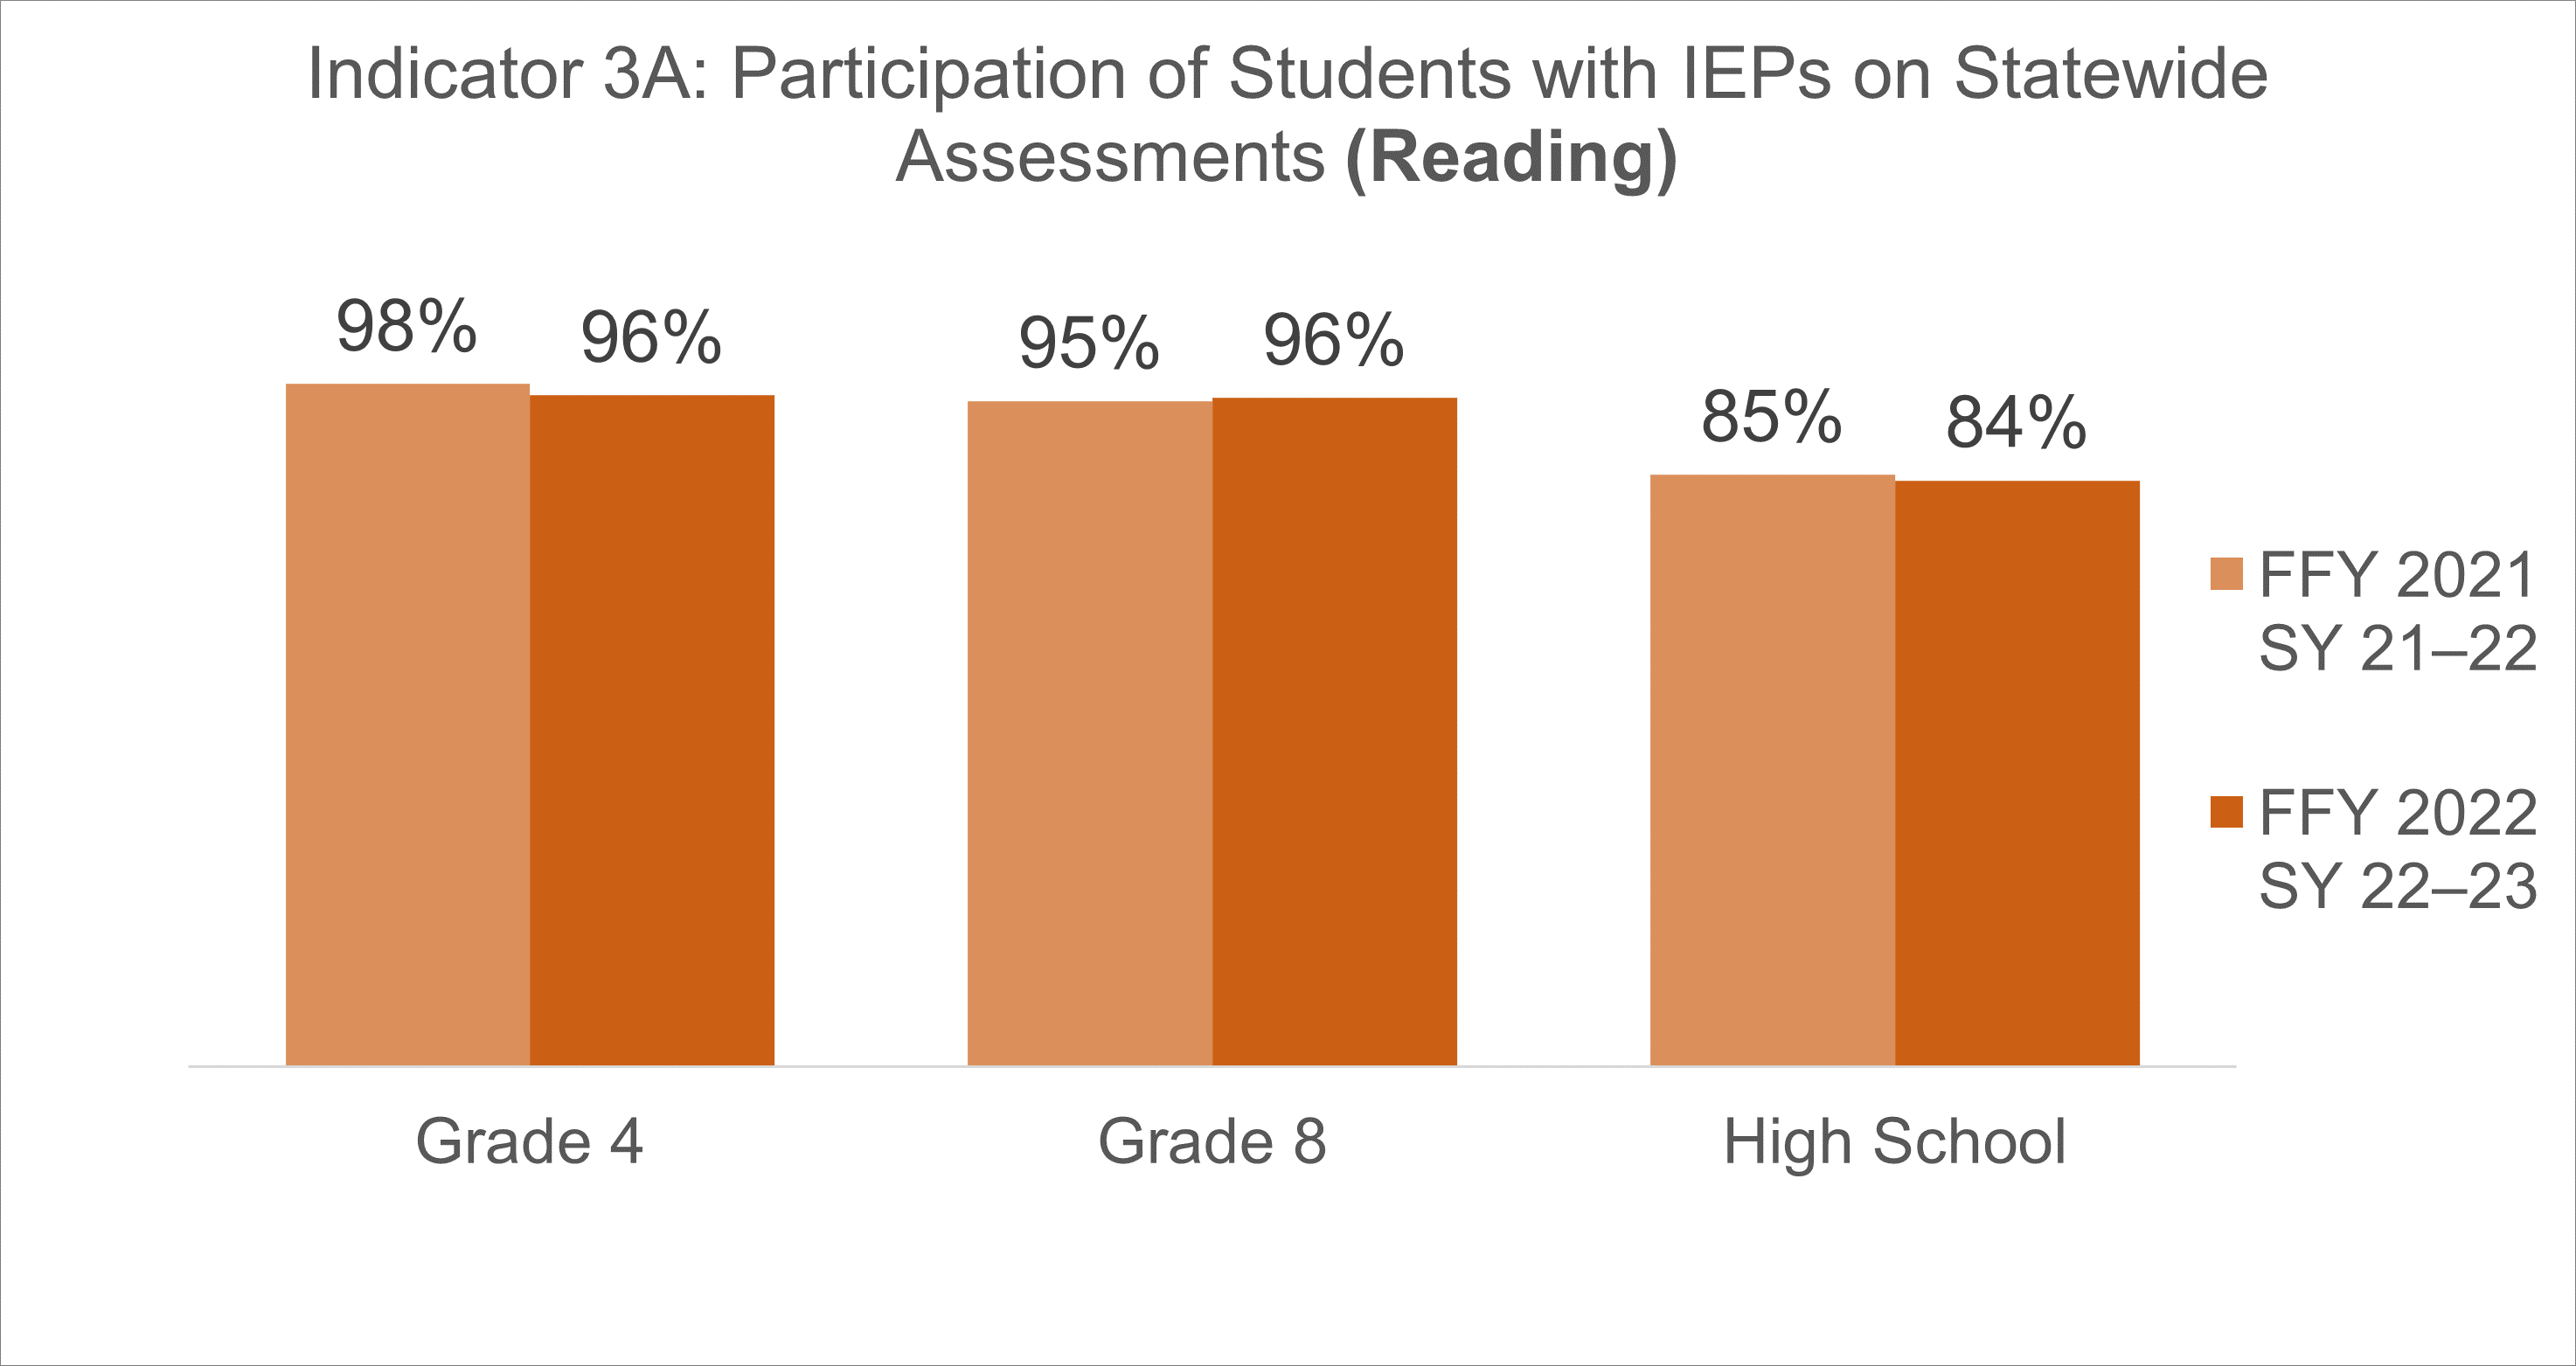
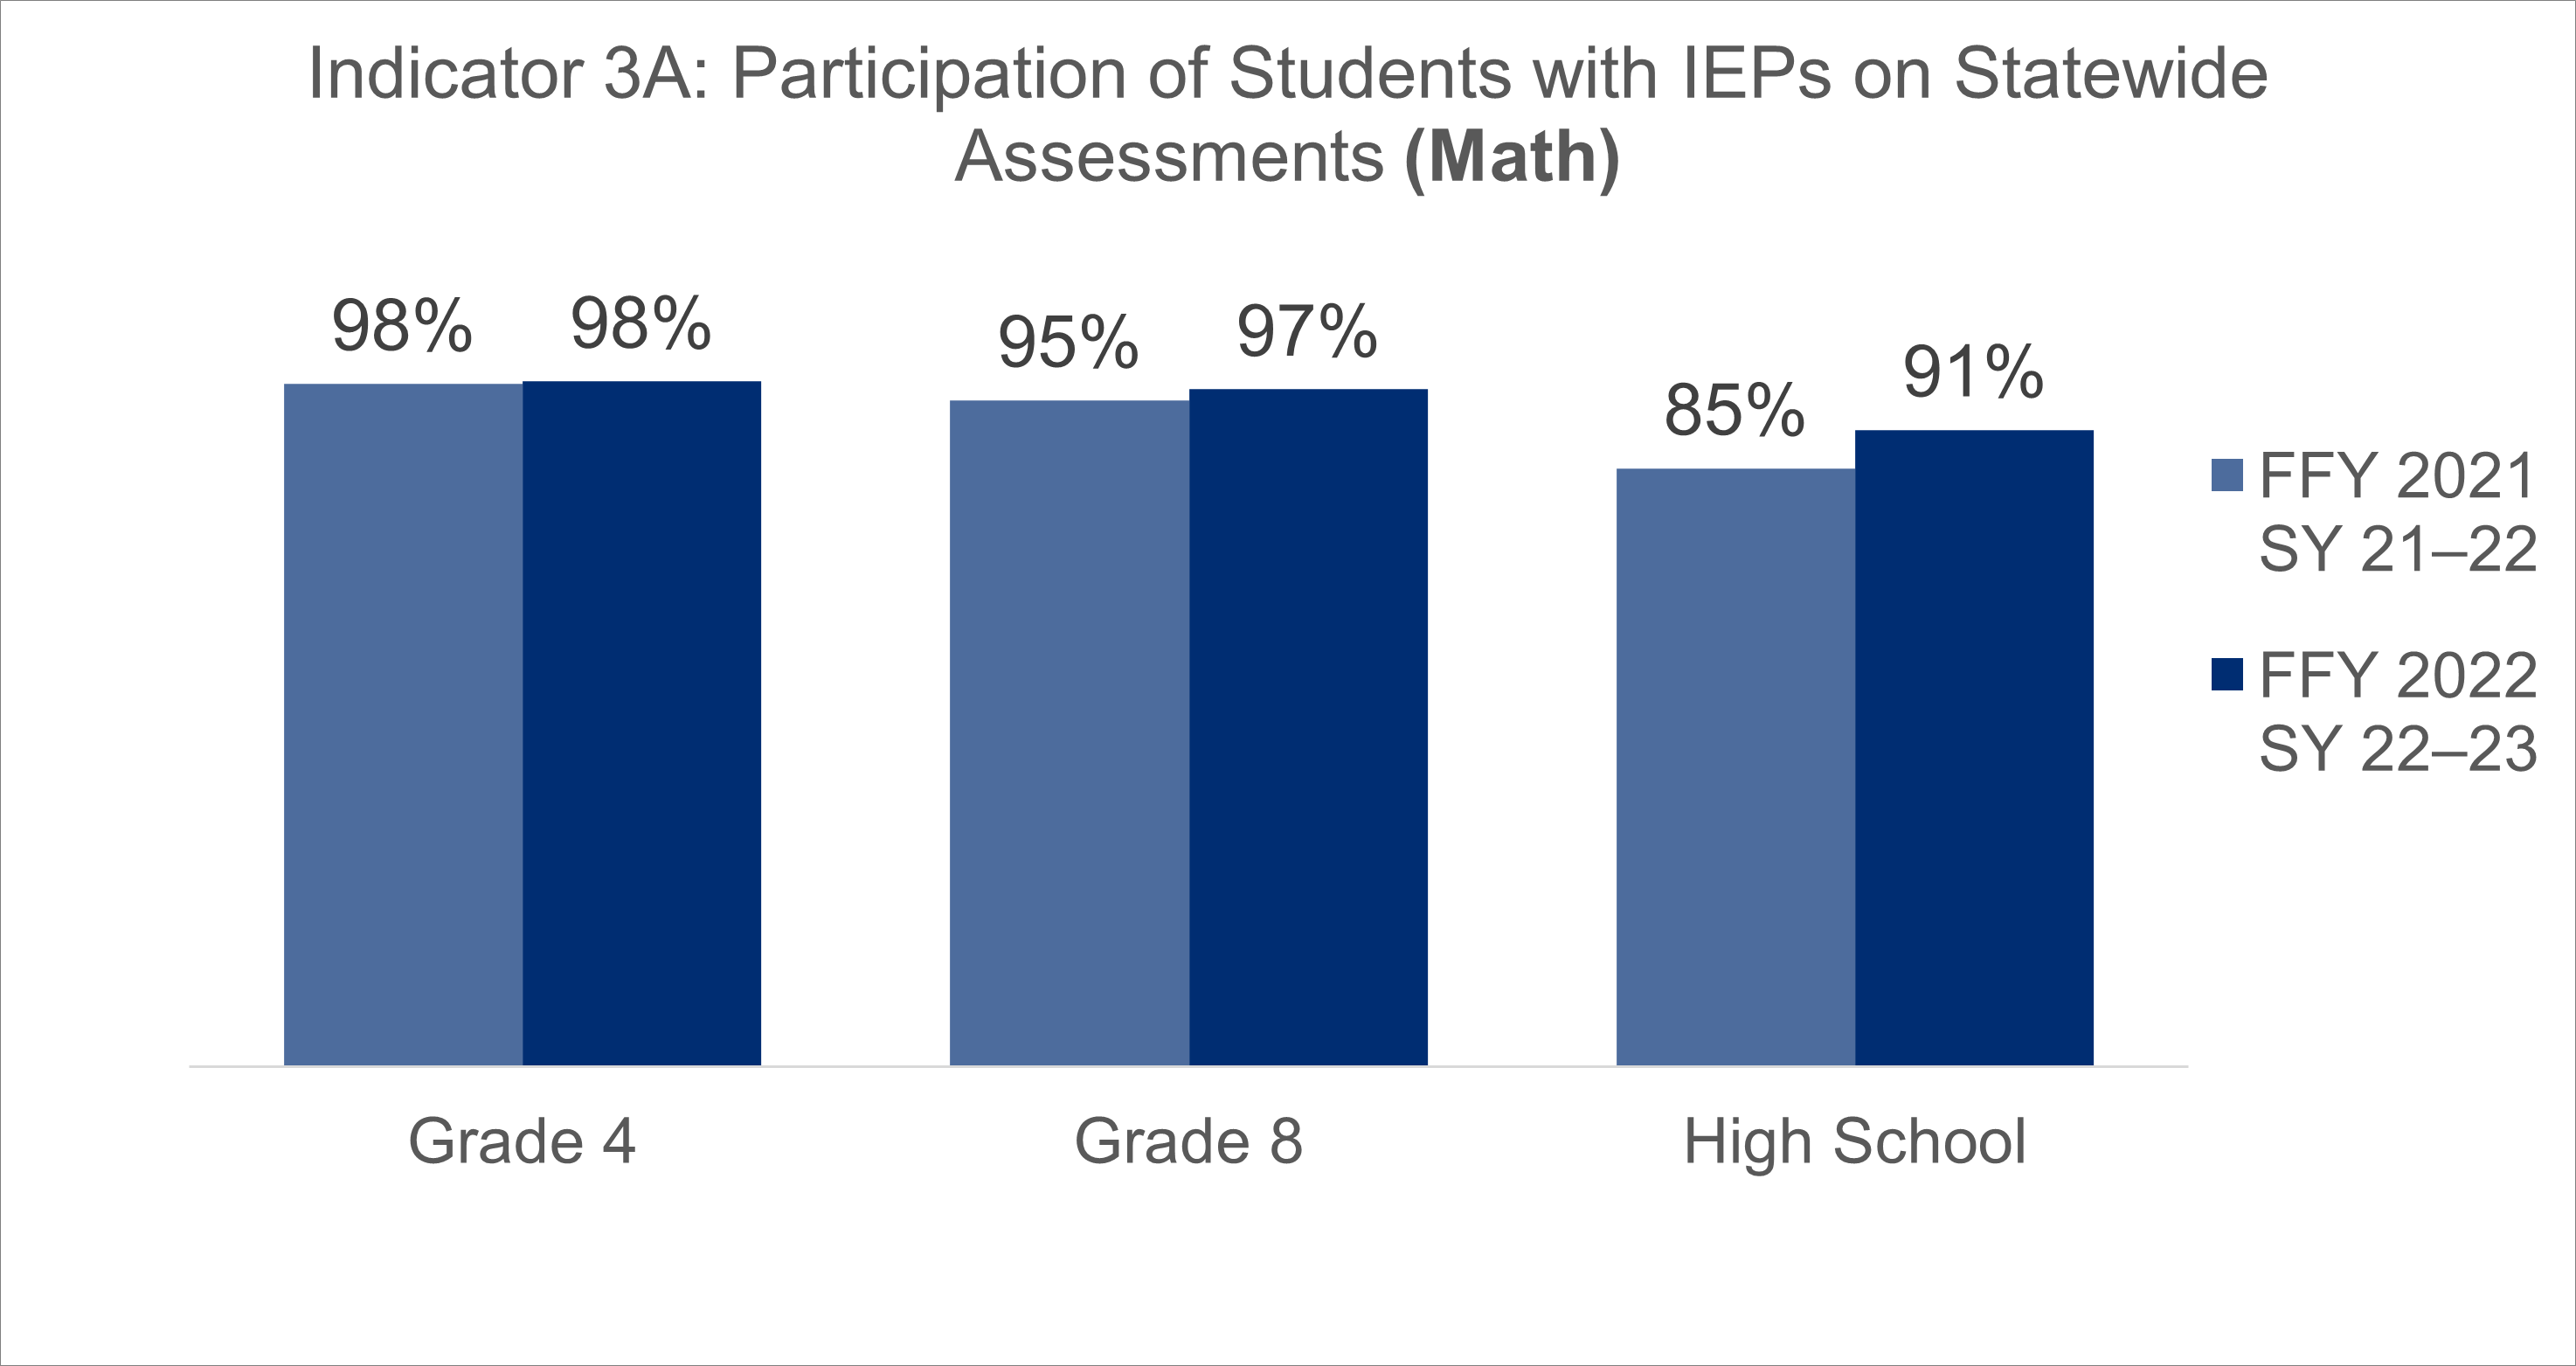
Participation of Students with IEPs on Statewide Reading and Math Assessments

Indicator 3a ELA FFY21 FFY22
Indicator 3a MA FFY21 FFY22.png

Reading Participation

Federal Fiscal Year (FFY)FFY 2021FFY 2022
Data from School Year (SY)SY 2021–2022SY 2022–2023
4th Grade98%96%
8th Grade 95%96%
High School85%84%

Math Participation

Federal Fiscal Year (FFY)FFY 2021FFY 2022
Data from School Year (SY)SY 2021–2022SY 2022–2023
4th Grade Participation 98%98%
8th Grade Participation 95%97%
High School Participation85%91%

Data for Indicator 3B

Proficiency on Reading and Math Assessments for Students with IEPs Against Grade-Level Academic Standards

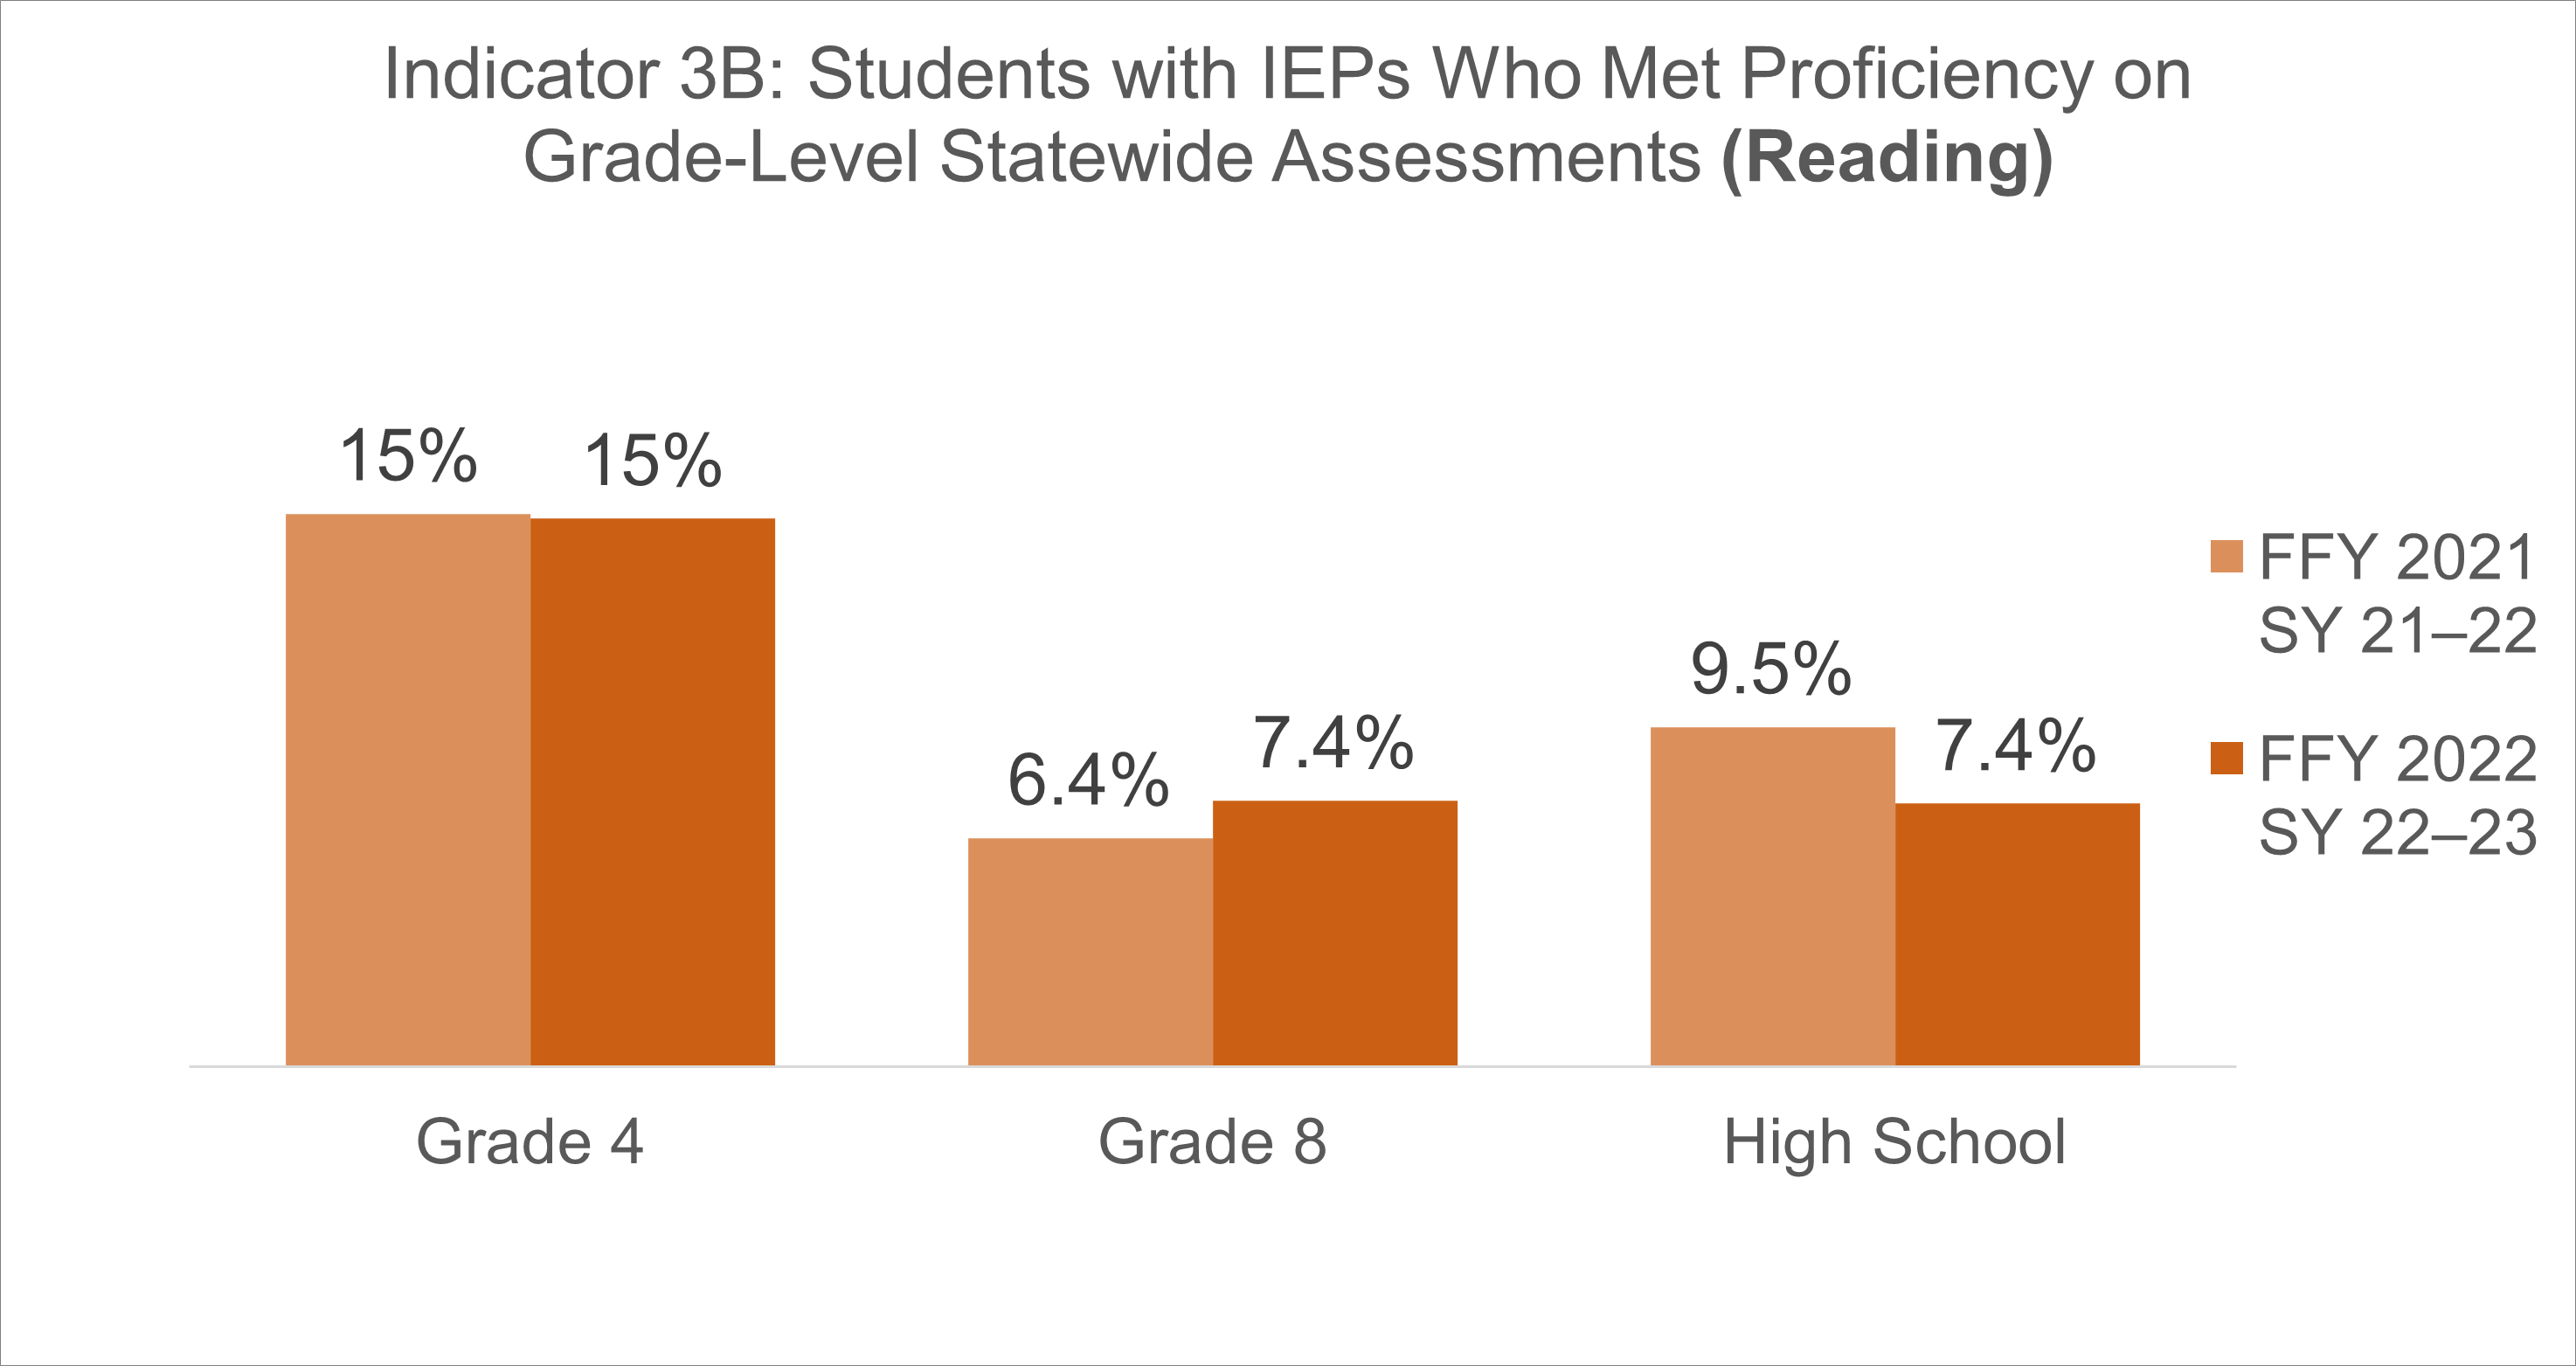
Indicator 3b Graph FFY21 FFY22 (v2).png
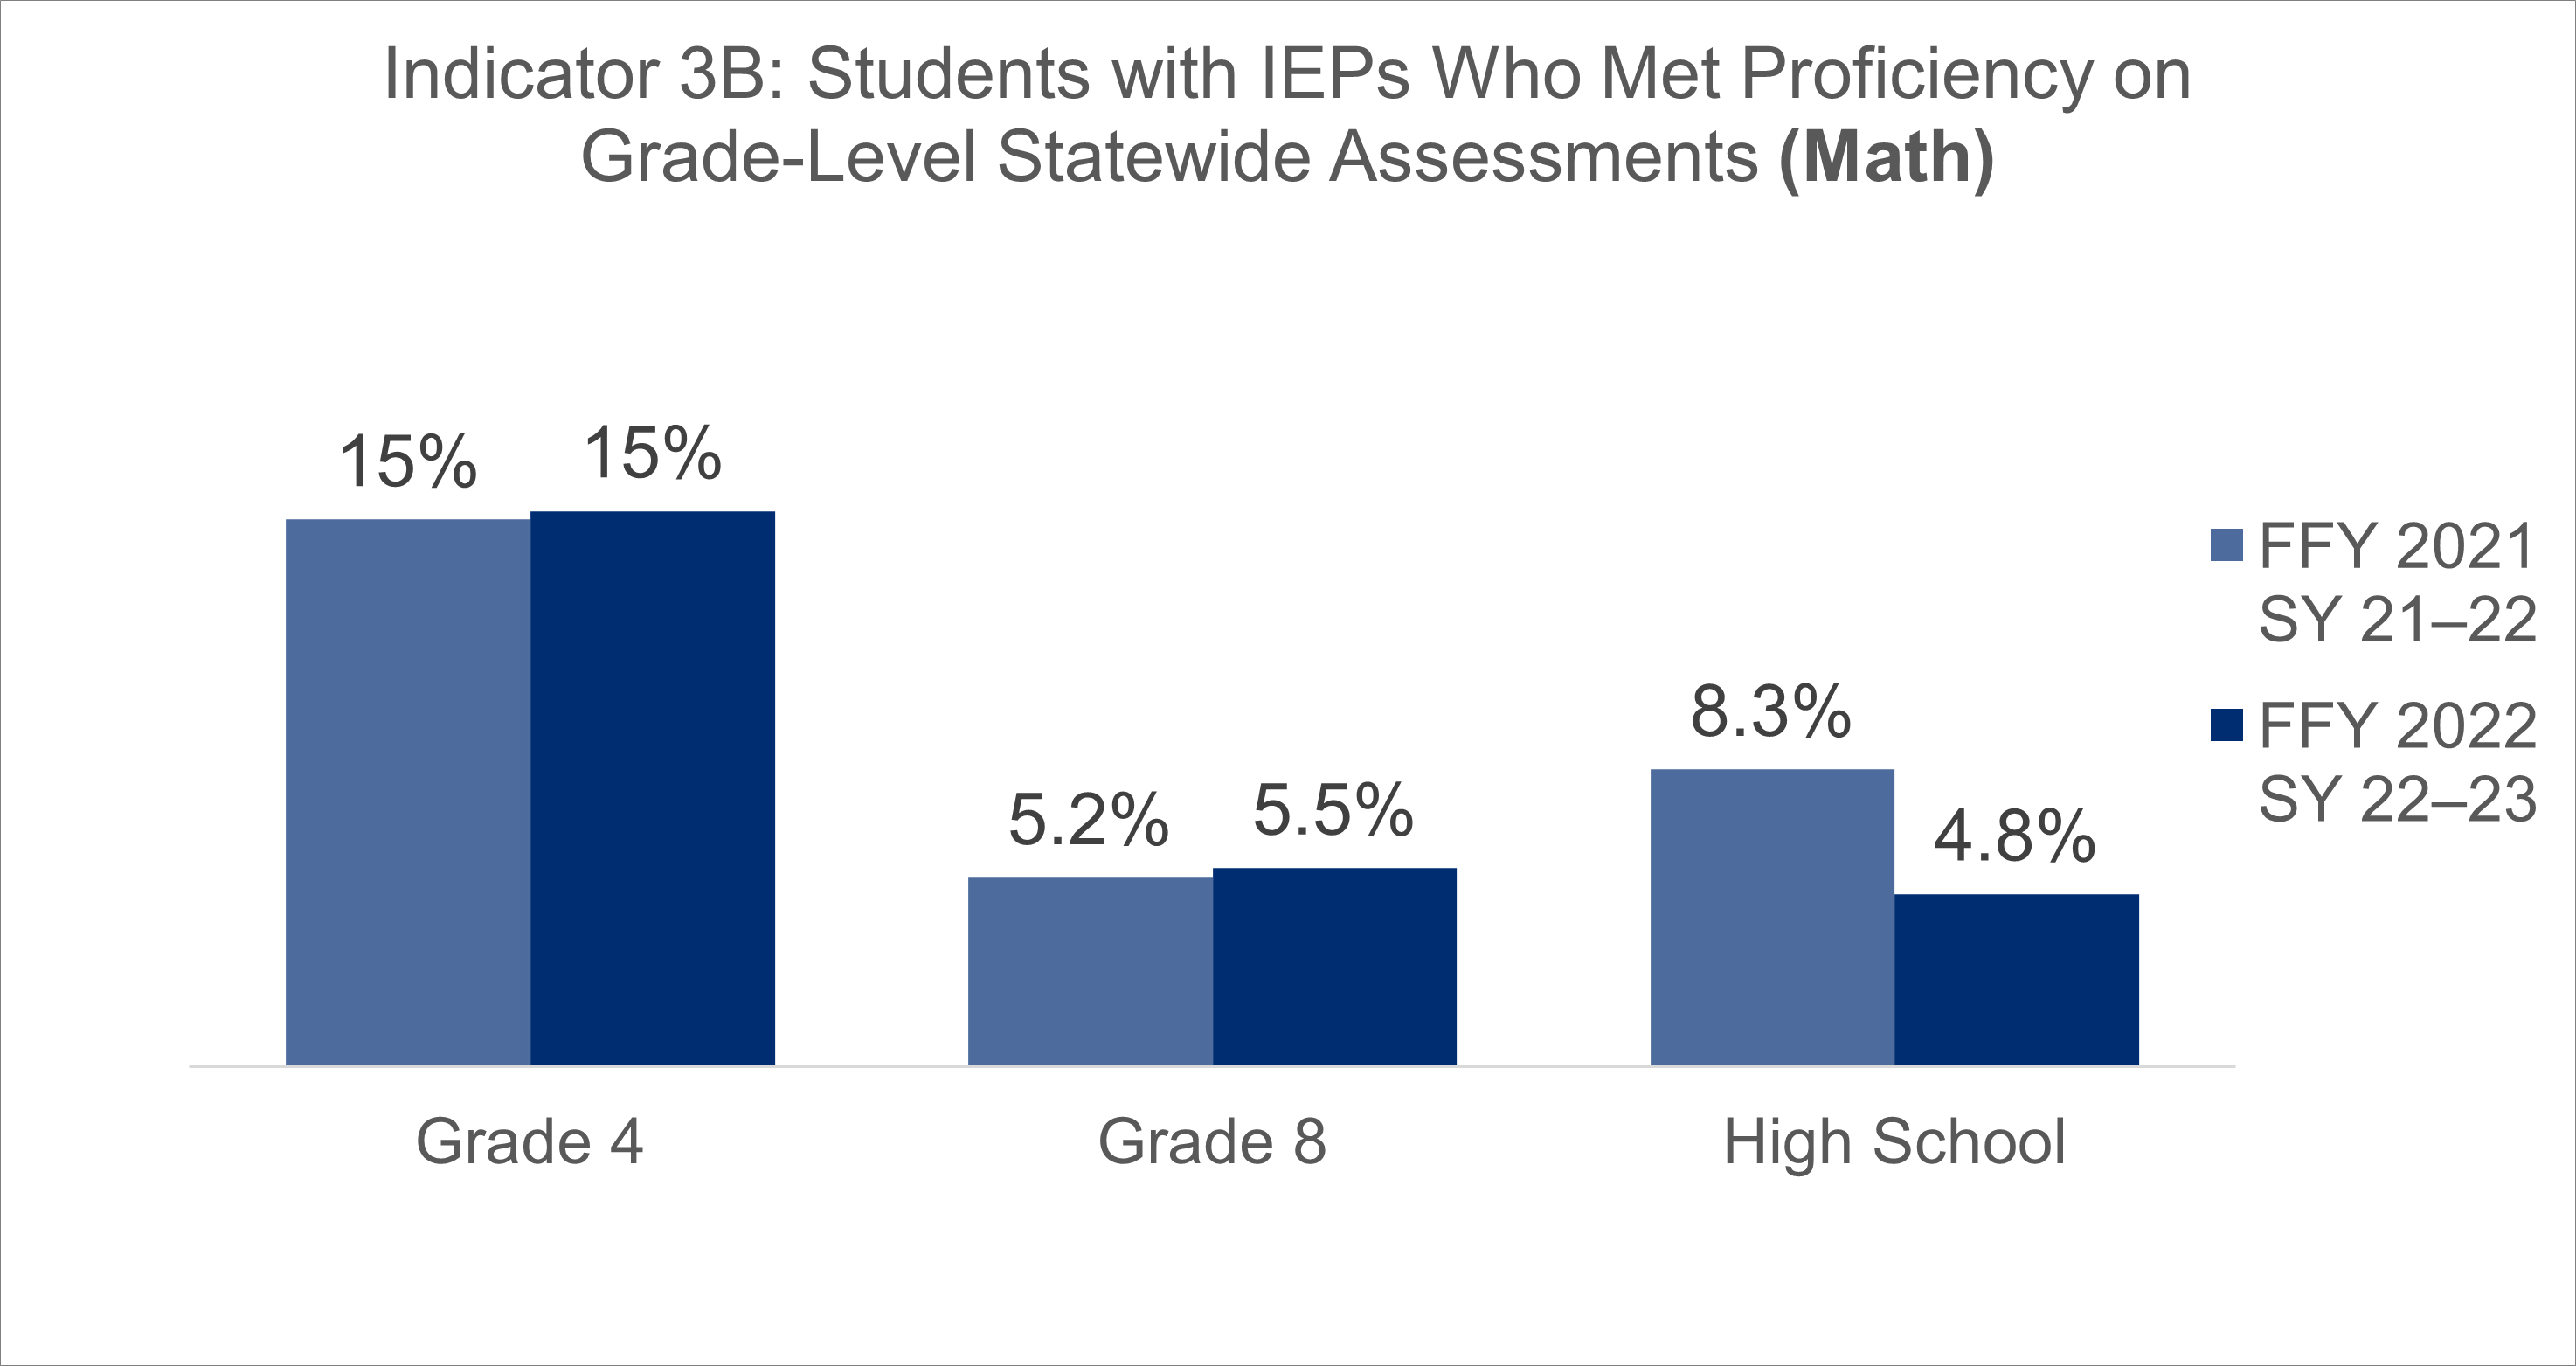
Indicator 3b MA FFY21 FFY22 (v3).png

Reading Proficiency (Grade-Level)

Federal Fiscal Year (FFY)FFY 2021FFY 2022
Data from School Year (SY)SY 2021–2022SY 2022–2023
4th Grade15%15%
8th Grade6.4%7.4%
High School9.5%7.4%

Math Proficiency (Grade-Level)

Federal Fiscal Year (FFY)FFY 2021FFY 2022
Data from School Year (SY)SY 2021–2022SY 2022–2023
4th Grade15%15%
8th Grade5.2%5.5%
High School8.3%4.8%

Data for Indicator 3C

Proficiency on Reading and Math Assessments for Students with IEPs Against Alternate Academic Standards

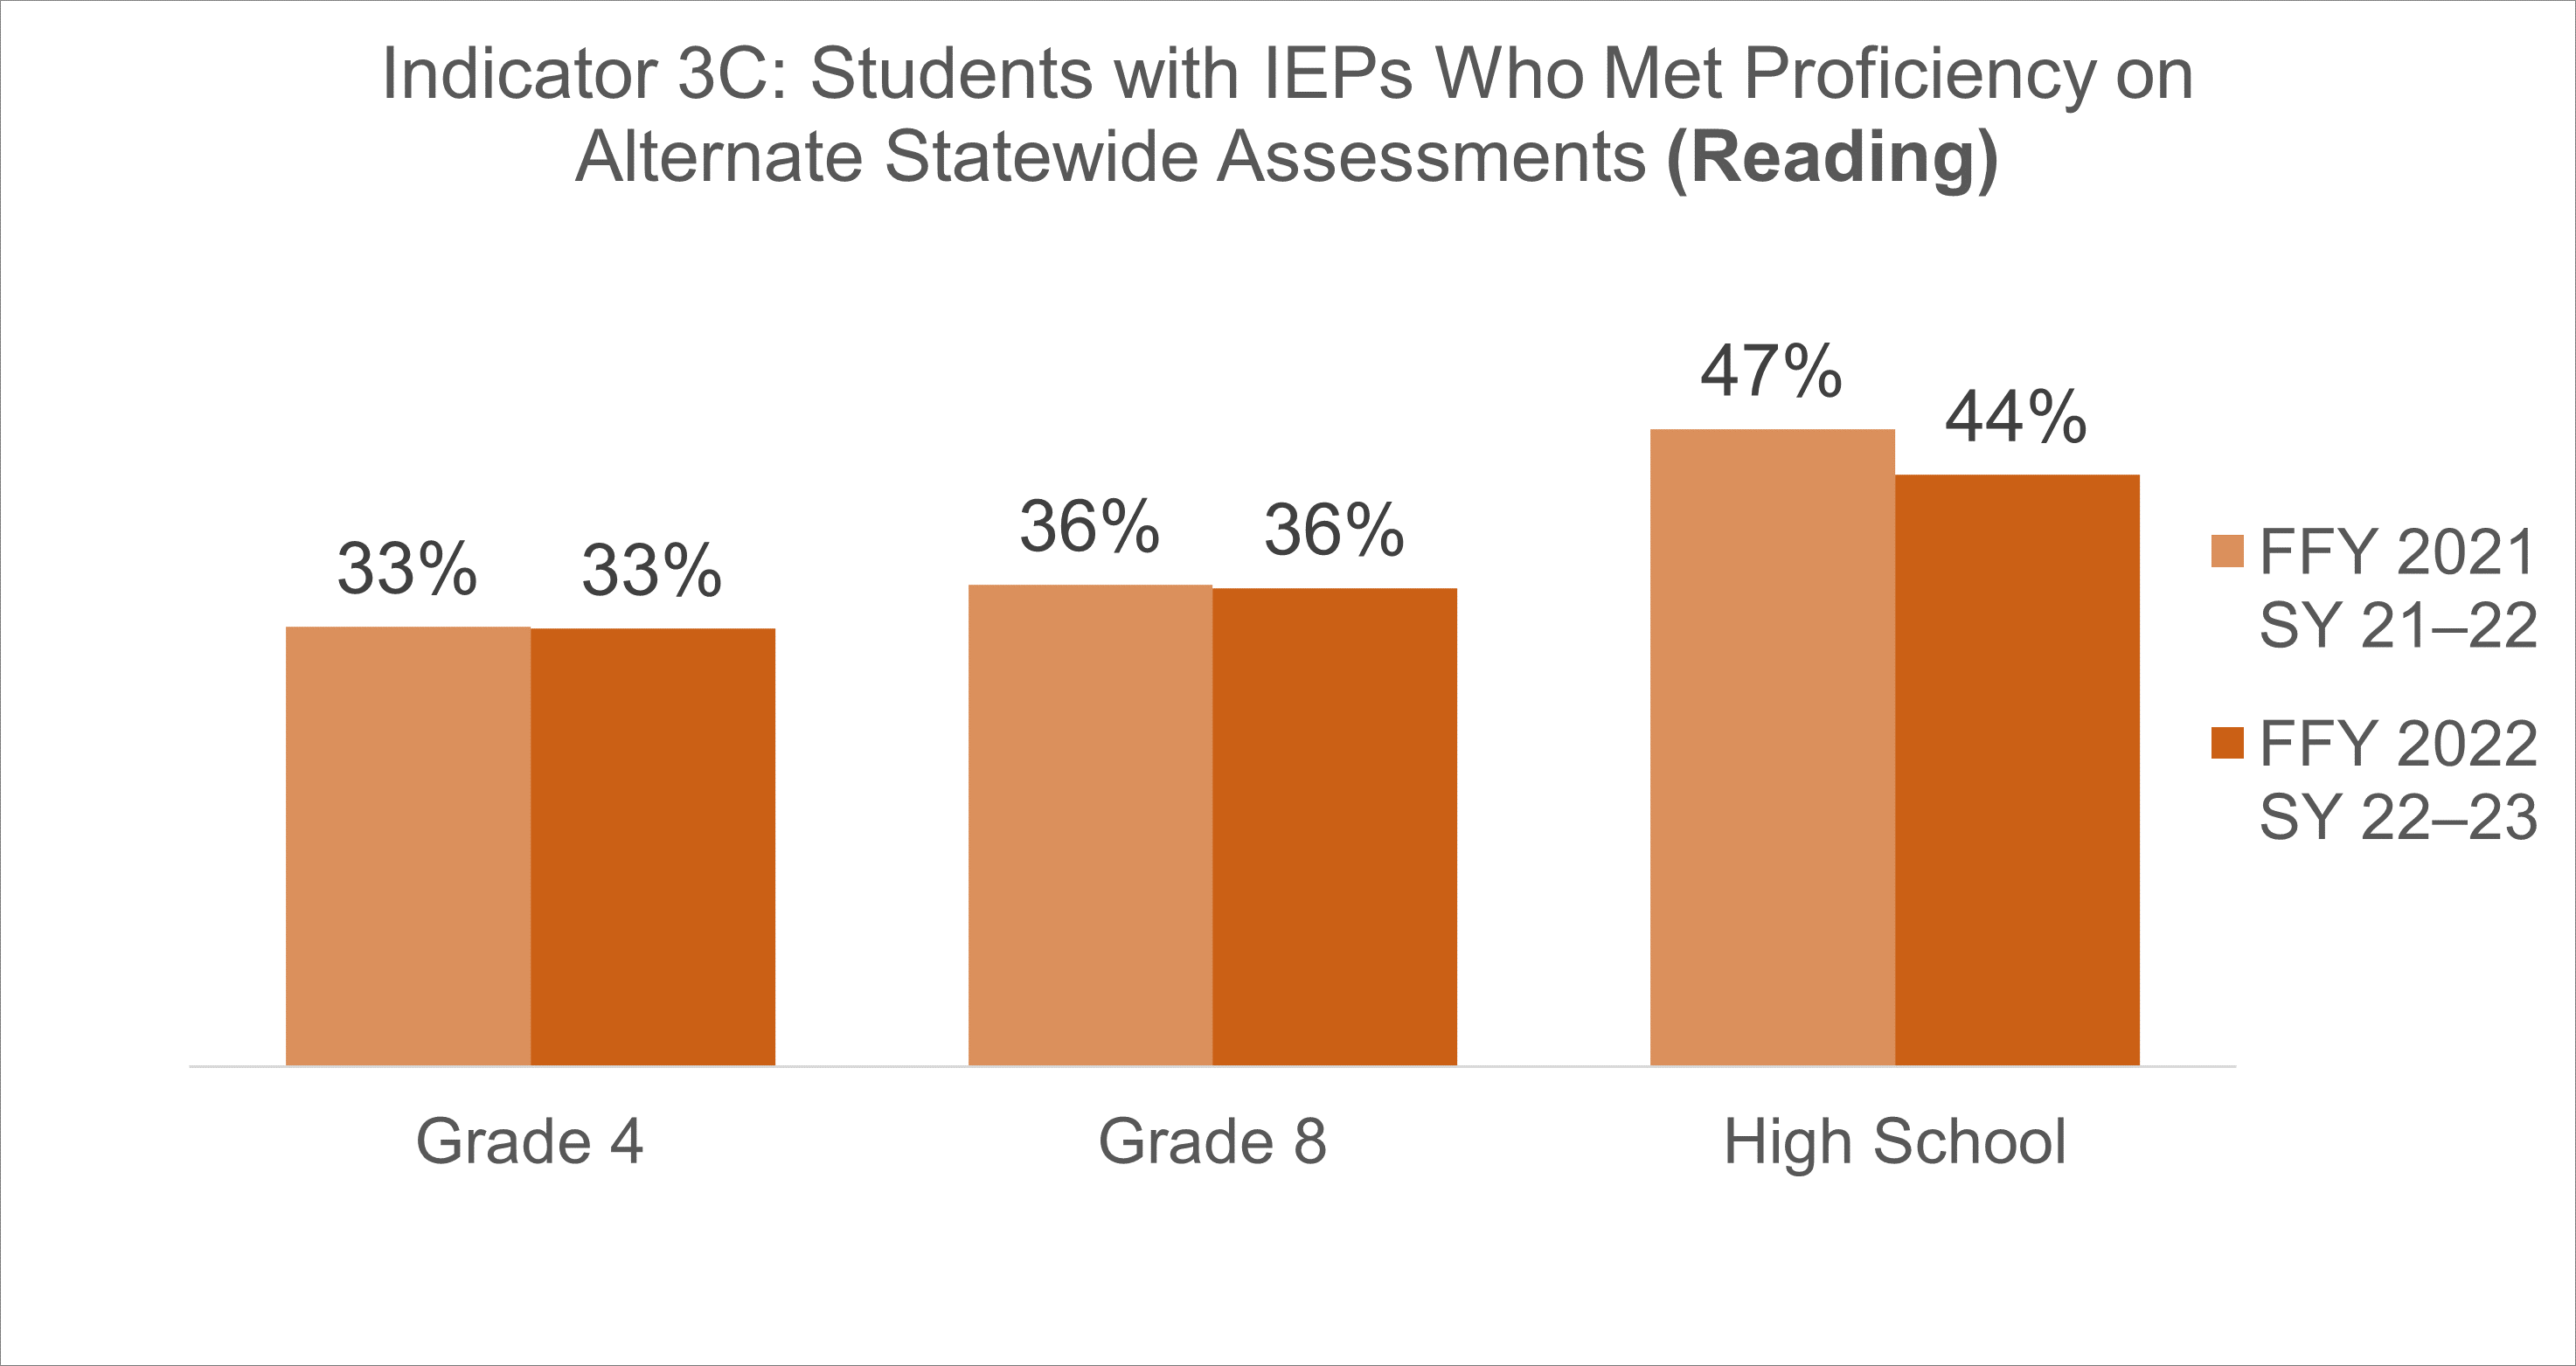
Indicator 3c ELA FFY21 FFY22.png
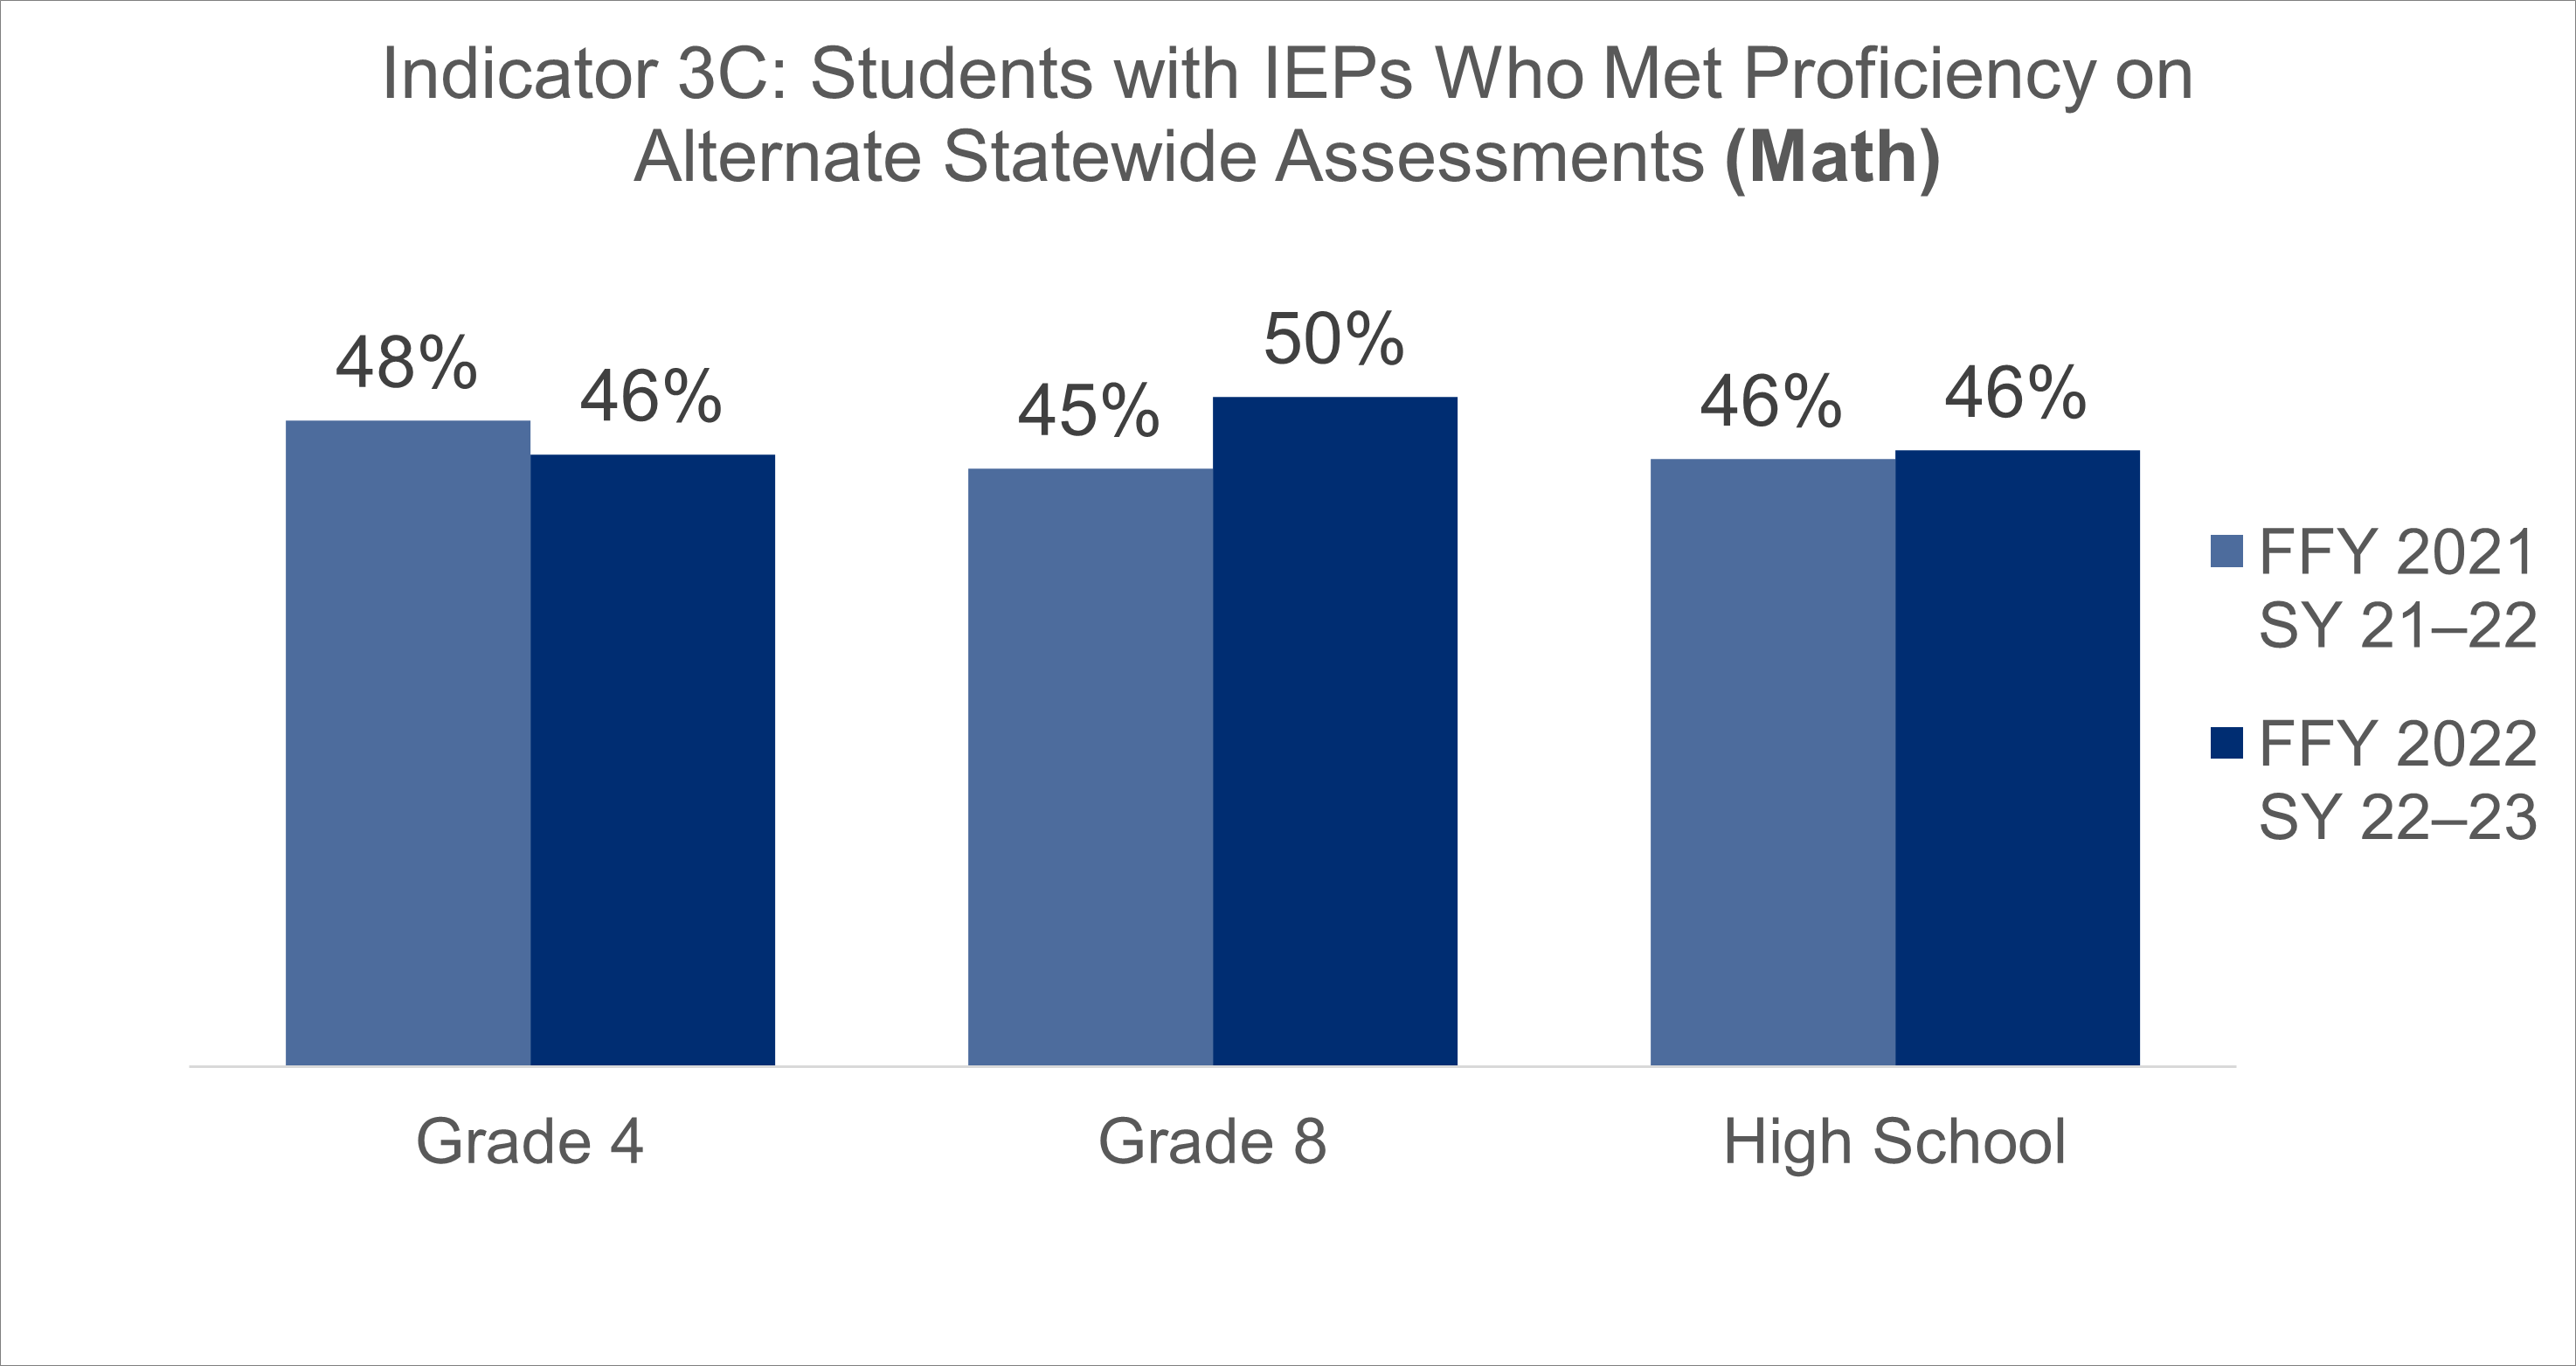
Indicator 3c MA FFY21 FFY22.png

Reading Proficiency (Alternate)

Federal Fiscal Year (FFY)FFY 2021FFY 2022
Data from School Year (SY)SY 2021–2022SY 2022–2023
4th Grade33%33%
8th Grade36%36%
High School47%44%

Math Proficiency (Alternate)

Federal Fiscal Year (FFY)FFY 2021FFY 2022
Data from School Year (SY)SY 2021–2022SY 2022–2023
4th Grade48%46%
8th Grade45%50%
High School46%46%

Data for Indicator 3D

Gap in Reading and Math Proficiency Rates Comparing Students with IEPs to All Students on Grade-Level Academic Standards

Indicator 3d ELA FFY21 FFY22.png
Indicator 3d MA FFY21 FFY22.png

Reading Gap

FFY 2022 (SY 22–23)Students With IEPsAll StudentsGap
4th Grade Proficiency15%45%30
8th Grade Proficiency7%36%29
High School Proficiency7%40%33

Math Gap

FFY 2022 (SY 22–23)Students With IEPsAll StudentsGap
4th Grade Proficiency15%39%24
8th Grade Proficiency6%27%21
High School Proficiency5%31%26

More Information

Information on Arizona's achievement testing for grade 3 through grade 8

Information on Arizona's achievement testing for high school

Questions or comments can be emailed to the ESS Operations inbox.

< Indicator 2SPP/APR HOMEIndicator 4 >